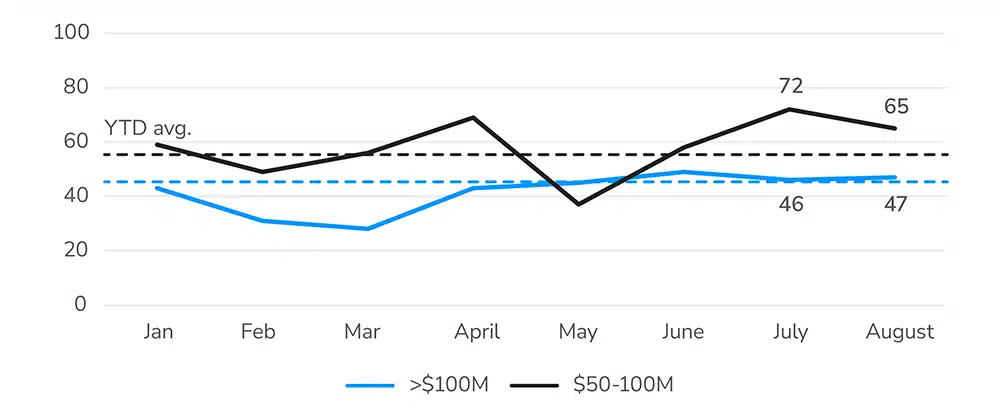
CRE transactions cooled slightly in August following July’s record-setting pace, but activity remains well ahead of 2025 averages. According to the LightBox Transaction Tracker, deals above $50 million totaled 112 for the month, 12% higher than the year-to-date monthly average but 5% lower than July’s peak.
Major Commercial Real Estate Deals (YTD 2025)

Nine-digit deals held steady at 47, showing little sign of weakness compared to the prior month. The mid-cap segment (deals priced $50 million-$100 million), by contrast, slipped to 65 after July’s high-water mark of 72. Even so, mid-cap activity is still running 12% above the year-to-date monthly average, underscoring the steady flow of capital into this range where underwriting is more transparent and financing conditions remain manageable.
“August looked more like a market catching its breath than one losing steam. Nine-figure deals held steady, which tells me there’s no real weakness at the top end. Mid-cap volume slipped from July’s peak but is still comfortably ahead of the yearly average. That’s a sign of discipline, not retreat, and it shows that capital is still very much in play.“
– Manus Clancy, Head of Data Strategy at LightBox
August Deals Highlight CRE’s Split Personality: Gains vs. Deep Discounts
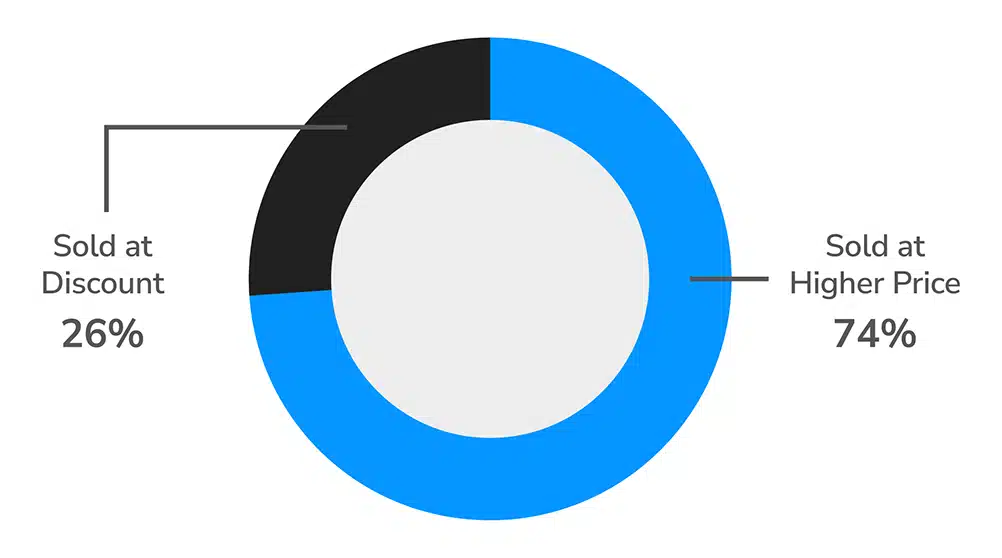
Across all size categories, the LightBox Transaction Tracker logged 865 closed U.S. deals in August, from an $85,000 office to a $1.6B apartment portfolio. For the 21% of deals with prior purchase data, 74% traded at a gain while 26% sold at a loss. Last month’s data offers evidence that most assets are appreciating, but when discounts occur, they can be sharp, particularly in the beleaguered office sector, a trend that marks a market in reset mode. There’s demonstrable strength in select sectors and geographies, yet pockets of distress dragging values lower in others.
The Extremes Tell the Story
In New York, the retail condo at the former New York Times Building sold for just $28M, a $267M loss from its 2015 price. Meanwhile, in Beverly Hills, a Rodeo Drive luxury retail property sold for $400M, up more than $320M since 2007. Together, these deals highlight the divergence between distress in weaker assets versus resilience and upside potential in trophy locations.
August CRE Deals
(with known prior purchase price. 21% of total deals)

This is just a snapshot of the trends shaping CRE deal flow. The full August Transaction Tracker Report includes sector-level details, top buyer rankings, and forward-looking analysis from our data team.
