
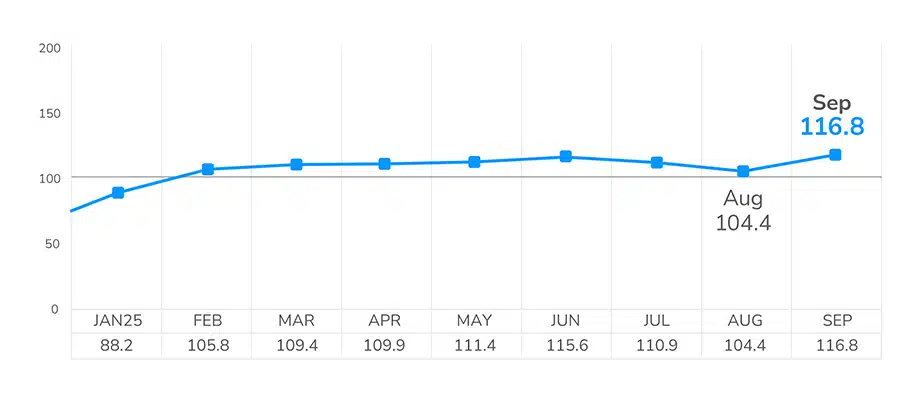
Momentum in commercial real estate snapped back in September after a modest August seasonal downtick. The LightBox CRE Activity Index climbed to 116.8 last month, setting a 2025 record. September’s strength was led by a late-Q3 surge in property listings combined with steady environmental due diligence and appraisal pipelines as buyers and lenders teed up Q4 closings. September’s 25-bps Fed cut helped boost the calculus behind risk-sensitive lending and the market is assuming additional cuts will soon follow.
Download the full September LightBox CRE Activity Report for a detailed breakdown of Index trends and the three forces shaping CRE in Q4.
The Index aggregates daily activity across three core CRE functions, environmental due diligence, commercial property listings, and lender-driven appraisals, drawing from more than 30,000 data points supporting lending and investment decisions.
Three Signals from September’s CRE Index
The CRE Activity Index is based on the average daily volume over the past month in each of the three functions that support CRE lending and investment:
- Commercial property listings surged 25% month over month, reversing two months of declines and returning to June-level strength as sellers re-entered the market.
- Phase I ESA volume held steady and elevated, just shy of June’s peak, signaling consistent pre-transaction and lending activity.
- Lender-driven commercial appraisals ticked up 1%, reflecting cautious optimism among lenders responding to improved rate clarity.
Monthly LightBox CRE Activity Index (YTD 2025)
“September’s rebound was both expected and encouraging. We’re seeing sellers return to the market and lenders gradually stepping up activity in response to the Fed’s easing. The combination of improved liquidity and rising confidence suggests that the August slowdown was a short-term lull, not a trend reversal.”
– Manus Clancy, Head of Data Strategy, LightBox
Q4: Risk On but Not Risk-Free
Given the rate cut and the strong CRE deal flow in September, absent a major market shock, investors are likely to continue to lean into assets in durable-demand segments (i.e., industrial, necessity retail, selective multifamily) while keeping underwriting conservative. Another rate cut in late October, and possibly December, would only add momentum to deal flow in Q4. Deloitte’s latest survey reported that the majority of investors still expect continued improvement over the near-term, encouraged by green shoots like stronger new loan volume, tighter mortgage spreads, a rebound in CMBS, and substantial dry powder. Importantly, nearly 75% of global respondents plan to increase CRE allocations over the next 12–18 months as long as financing windows stay open.
“With multiple tailwinds in play, from rate relief to stronger deal flow, the market is entering Q4 in better shape than many expected earlier this summer,” said Clancy.
Potential upsets include: a continued deterioration in soft sentiment data that could impact business investment and consumer spending, weak earnings that would deflate NOI and leasing, tariff pass-through driving inflation higher, and a prolonged shutdown. Based on current data, Q4 is shaping up to be a strong and steady close to the year. CRE’s core remains disciplined with improving odds of a broader uptick into 2026 if policy, rates, and credit conditions cooperate.
ABOUT THE MONTHLY LIGHTBOX CRE INDEX
The LightBox Monthly CRE Activity Index is an aggregate that represents a composite measure of movements across activity in appraisals, environmental due diligence, and commercial property listings as a barometer of broad industry shifts in response to changes in market conditions. To receive LightBox reports, subscribe to Insights.