
The LightBox CRE Activity Index, an aggregate measure built on the foundation of 30,000+ real-time signals spanning appraisals, new listings, and environmental due diligence, offers an early read on market momentum as dealmakers navigate shifting economic conditions and lingering volatility.
In November, the Index dipped from 106.2 to 99.4, a 6% decline that was far milder than the historical 14% October-to-November slowdown. The Index returned to double-digit territory for the first time since January but continues to signal a market cooling, not retrenching.
The November LightBox CRE Activity Index reveals:
- Where seller re-engagement is accelerating, with listings up 37% year over year, and what rising inventory signals for early-2026 deal flow.
- Which sectors are driving steady early-stage momentum as ESA volume climbs 12% year over year amid strong activity tied to data centers, manufacturing, multifamily, and industrial.
- How an eleven-month streak of appraisal stability reflects improving refinancing pipelines and growing lender willingness to underwrite as rates ease.
LightBox CRE Activity Index At a Glance
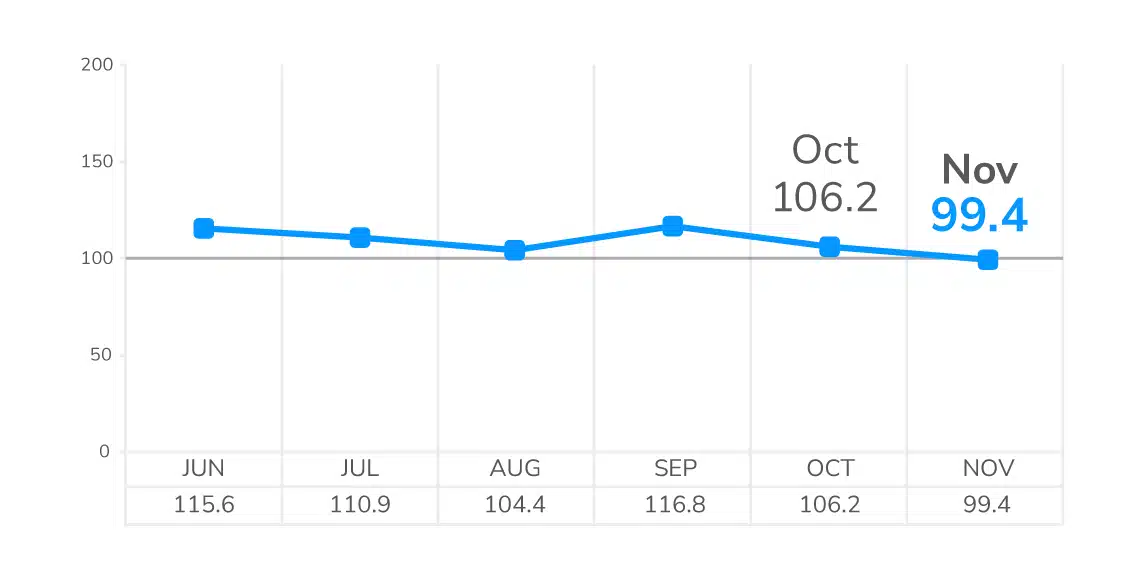
November’s Index reading extends a remarkably strong run in 2025. The Index has spent nearly the entire year at or near triple-digit territory and remains well above the 83.3 recorded last year during the election-driven slump.
Market components reflect recalibration rather than contraction: listings peaked in September before moderating seasonally, ESA volume has remained in a steady band since mid-summer, and appraisals show banks stepping back into the market after last year’s retreat.
These trends highlight a CRE market adapting to macroeconomic crosscurrents yet maintaining underlying strength.
How this momentum carries into early 2026 will hinge on credit availability, rate conditions, market confidence, and clarity in economic indicators.