

Dianne P. Crocker, Principal Analyst, LightBox
Phase I ESA Sector Ends on Low Note, Uptick Expected by Mid-Year
Curious how the US Phase I ESA industry is weathering the storm as commercial real estate and lending volumes remain 20-30% below pre-COVID averages? Wondering if your firm’s Phase I ESA business outperformed industry benchmarks? These are questions I’m frequently asked, especially in these uncertain market times. The good news is you’ll find our latest round of Phase I ESA market metrics, along with the latest take on what 2024 will look like in the LightBox Phase I ESA Market Snapshot 4Q 2023. Preliminary ScoreKeeper stats suggest it will likely be at least Q2 before the market sees any measurable shift toward recovery. US Phase I ESA volume fell by 3 percent in January compared to January 2023, but was stable in February compared to last year so it will be interesting to see if March delivers the first monthly increase of Q1.
Here are a few highlights from our latest report—and what you can expect over the near-term:
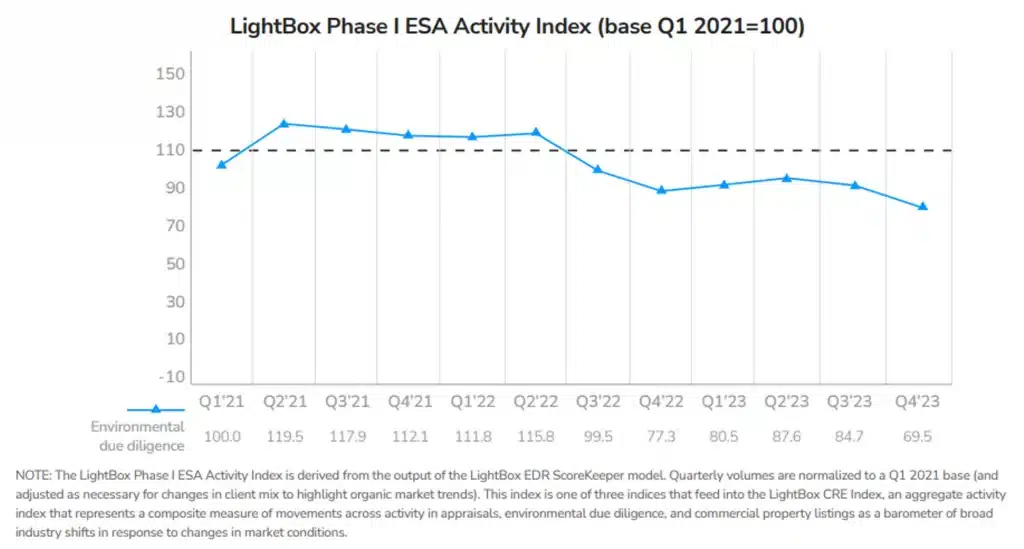
- The LightBox Phase I ESA Activity Index declined to 69.5 in Q4 2023 from 84.7 in Q3 2023 and 77.3 one year prior as lending and investment remain subdued in the high interest rate cycle.
- US Phase I ESA volume experienced a slow year-end with a 10% Q4 2023 decline compared to Q4 2022 after only modest quarterly increases earlier in the year.
- Total U.S. Phase I ESA volume remains 15% below the pre-pandemic average as real estate transactions struggle in today’s environment of constrained debt capital and price uncertainty.
- Las Vegas, Baltimore, Nashville, and Dallas delivered moderate quarterly increases in Phase I ESA activity in Q4 2023, despite slower-than-normal industry volume.
- January’s Phase I ESA volume fell only 3% versus last January and was stable in February—early signs of moderation and notably less severe than December’s 13% YoY decline.
So far in 2024, the Mortgage Bankers Association issued a 26% forecast for CRE lending and estimates of dealmaking are in the 10-30% range. It’s becoming less and less likely that the Fed plans to cut interest rates anytime soon so the market could see a slow first half as investment dollars and loan originations will only thaw after interest rate cuts begin. After that, the LightBox Phase I ESA Index will reflect the related uptick in environmental due diligence to support a new round of dealmaking (and restrained lending) in the second half of the year. The timing and magnitude of the increase will depend largely on when and by how much the Fed cuts rates, and how quickly the market reacts with bringing properties to the selling block and reinvigorating loan originations. There will also be demand for environmental due diligence this year as the expected wave of loan maturities triggers the need for risk assessments before loans and distressed assets change hands. Property pricing will reset and approach a new equilibrium but until then, caution is in order to ensure that environmental risks will not adversely impact a property’s value over time.
Read the Full Report
The LightBox CRE Market Snapshot Series, Q4 2023—Part 2: Phase I ESA Trends contains more detailed information and metrics on trends in Phase I ESA volume by year, quarter region, metro and for the LightBox 25 Index.
Part 1 of the CRE Market Snapshot Series provides analysis of the lender-driven appraisal market and Part 3 highlights trends in capital and investment markets. For more information about this report series or the data, email insights@lighboxre.com