
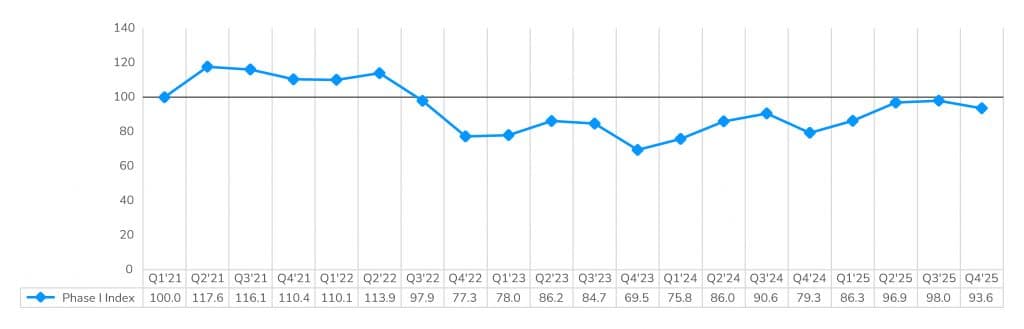
As we move deeper into Q1, LightBox’s Q4 Phase I ESA Index offers a read into where CRE capital is focusing this year. The Phase I ESA Activity Index eased to 93.6 in Q4 2025, down from 98.0 in Q3, reflecting a typical year-end slowdown that was notably milder than historical averages.
Insights covered in the Q4 Phase I ESA Snapshot include:
- The top 20 investors driving Phase I activity
- National and regional Phase I ESA volume trends across key sectors
- The fastest-growing markets and metros of the quarter
- Sentiment insights from the LightBox Environmental Due Diligence Market Advisory Council
- Emerging headwinds and opportunities shaping 2026 deal flow
Phase I ESA Activity Remains Well Above Prior-Year Levels
The LightBox Phase I ESA Index moderated to 93.6 in Q4 2025, down from 98.0 in Q3, reflecting a typical year-end slowdown following two quarters of steady gains. Importantly, the Q3-to-Q4 decline of roughly 9% was meaningfully less severe than the historical 18% drop observed over the prior three years, a reassuring sign of greater market resilience as 2025 ended.
Activity earlier in the year showed a clear recovery trend, with the Index rising from 86.3 in Q1 to 96.9 in Q2, before peaking near 98.0 in Q3. On a year-over-year basis, Q4 activity remained well above Q4 2024’s low of 79.3, a clear indication of the strength of market’s rebound over the past 12 months.
LightBox Phase I ESA Activity Index (base Q1 2021=100)
NOTE: The LightBox Phase I ESA Activity Index is derived from the output of the LightBox EDR ScoreKeeper model. Quarterly volumes are normalized to a Q1 2021 base and calculated based on an average volume per business day (adjusted as necessary for changes in client mix to highlight organic market trends). This index is one of three indices that feed into the LightBox CRE Index, an aggregate activity index that represents a composite measure of movements across activity in appraisals, environmental due diligence, and commercial property listings as a barometer of broad industry shifts in response to changes in market conditions.
A Mix of Selective Momentum and Cautious Confidence
Looking ahead, the backdrop remains modestly optimistic but measured. Debt and equity capital are widely available, pricing gaps are narrowing, and underwriting remains disciplined. December’s surge in large transactions, with nine-figure deals up 44% month over month, illustrates how improving sentiment earlier in the fall translated into year-end execution. Consistent with this view, 75% of Market Advisory Council members expect a modest uptick in Phase I ESA volume in 2026, rather than a sharp acceleration.
Download the full report to access the complete forecast and data.
For more information about this report series or the data, email Insights@lightboxRE.com