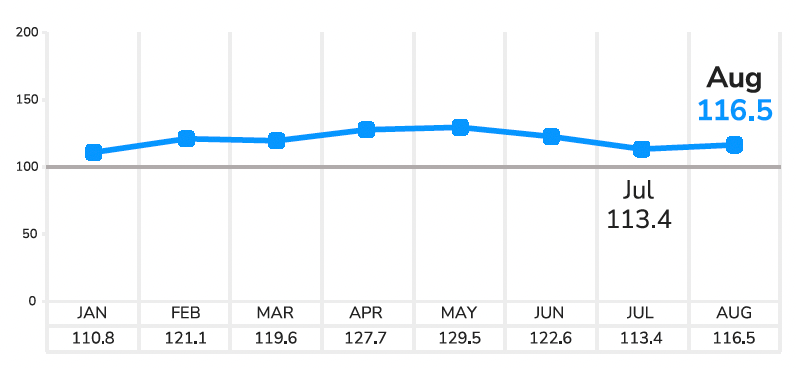
The LightBox CRE Activity Index rose to 116.5 in August 2026, up from 113.4 in July and 104.3 a year earlier. The increase was driven by stronger commercial property listings and Phase I environmental due diligence activity, while lender-driven appraisal activity declined.
The result points to renewed commercial real estate activity heading into the fall, but financing conditions remain an important constraint on how quickly opportunities move from the pipeline to closing.
What does the August 2026 CRE Activity Index show?
The LightBox CRE Activity Index tracks three leading indicators of U.S. commercial real estate activity: commercial property listings, Phase I environmental site assessments, and lender-driven appraisals.
In August, those indicators told a mixed but increasingly active story.
Commercial property listings rose 20% from July, reversing three consecutive months of decline. Because listings represent the early stages of the transaction cycle, the increase suggests more sellers are bringing properties to market ahead of the traditional fall dealmaking period.
Phase I environmental site assessment activity increased 3% in August and remained 5% above year-earlier levels. Environmental due diligence is associated with acquisitions, originations, refinancings, and distressed transactions, making the increase another sign that CRE transaction pipelines are rebuilding.
Lender-driven appraisal volume declined 29% from July’s 2026 high. That decline suggests financing remains a source of friction even as activity strengthens earlier in the transaction process.
Buyers Are Still Active
The increase in early-stage activity is occurring alongside continued transaction volume.
LightBox Transaction Tracker data recorded nearly 1,800 commercial real estate transactions closing in August, up 6% from July. Buyers also continue to evaluate opportunities across the market, reinforcing the idea that capital has not left CRE—it has become more selective.
Investors remain active across multifamily, industrial, retail, and data-center-related assets, while opportunistic capital continues to look for properties where pricing has adjusted to current market conditions.
For brokers and investors, the rebound in listings is particularly important. More inventory means more opportunities, but buyers are placing greater emphasis on durable income, occupancy, market fundamentals, and a clear path to returns.
Financing Remains the Key Constraint
The August data also highlights the difference between market interest and deal execution.
Competition among banks, life companies, CMBS lenders, and private credit providers continues to create financing capacity. The bigger question is whether individual deals can support today’s cost of debt.
That helps explain the divergence in the August CRE Activity Index:
- Listings are increasing.
- Due diligence activity is rising.
- Transactions are still closing.
- Appraisal activity weakened.
In other words, more opportunities are entering the pipeline, but financing economics may still determine which transactions make it through.
A Rebound, Not Yet a Breakout
The LightBox CRE Activity Index reached a 2026 high of 129.4 in May before declining through June and July.
August’s 116.5 reading remains below that spring peak, but it is well ahead of August 2025. That makes the latest increase more indicative of renewed market engagement than broad-based acceleration.
For commercial real estate professionals, the next question is whether rising listings and due diligence activity translate into stronger financing and transaction activity as the market moves into Q4.
What Should Brokers and Investors Watch Next?
September has historically brought a pickup in CRE activity as buyers and sellers focus on transactions they hope to complete before year-end.
August provides a stronger starting point for that fall push. More properties are coming to market, buyers remain active, and due diligence activity is increasing.
The key variable will be whether financing conditions allow more of those opportunities to progress from evaluation to execution.
Read the August 2026 LightBox CRE Activity Index for the full analysis of commercial property listings, Phase I environmental due diligence, lender appraisals, transaction activity, and the economic forces shaping the CRE market.
Frequently Asked Questions
What is the LightBox CRE Activity Index?
The LightBox CRE Activity Index tracks three leading indicators of U.S. commercial real estate activity: commercial property listings, Phase I environmental site assessments, and lender-driven appraisals.
What was the CRE Activity Index in August 2026?
The LightBox CRE Activity Index was 116.5 in August 2026, up from 113.4 in July and 104.3 in August 2025.
Why did CRE activity increase in August 2026?
The August increase was supported by a 20% month-over-month rise in commercial property listings and a 3% increase in Phase I environmental site assessment activity.
What does the August CRE Activity Index mean for brokers and investors?
The data suggests more commercial properties are entering the transaction pipeline and buyers remain active. However, weaker lender appraisal activity indicates that financing costs and underwriting conditions may continue to influence how quickly deals move toward closing.
For more information about this report or the data, email insights@lightboxre.com
