
CRE Activity Pulls Back as Market Uncertainty Builds
Commercial real estate activity lost more momentum in July as elevated borrowing costs, geopolitical uncertainty, and shifting expectations for monetary policy continued to weigh on the market.
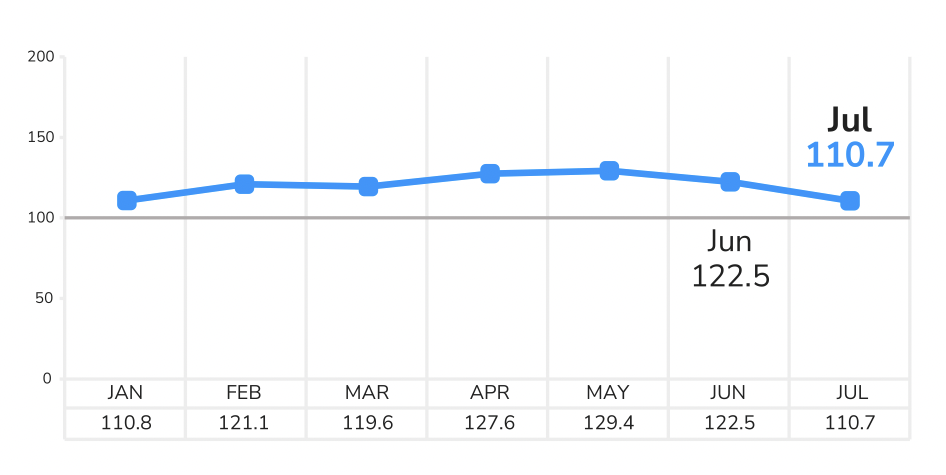
The latest LightBox CRE Activity Index fell to 110.7 in July from 122.5 in June, marking its second consecutive monthly decline and putting the Index 14% below its May 2026 high of 129.4. Despite the pullback, the July reading remained above the Index baseline of 100 and was nearly identical to the 110.8 recorded a year earlier.
The numbers suggest CRE has given back some of the momentum it built during the spring rather than entered a broad market contraction. That distinction matters. While some indicators point to increased caution, others show that investors and lenders remain active.
Three Signals Tell a Mixed Story
The three components that make up the LightBox CRE Activity Index—commercial property listings, Phase I environmental site assessments, and lender-driven appraisals—moved in different directions during July.
Commercial listings showed the most significant weakness. Average daily listings fell 20% from June, marking their third consecutive monthly decline after reaching a 2026 peak in April. Listing activity was roughly even with a year ago, suggesting that some sellers may be holding back as market volatility increases.
Environmental due diligence also softened, but remained relatively resilient. Average daily Phase I ESA activity declined 6% from June, its second consecutive monthly decrease. Even after that decline, activity remained 3% above year-ago levels—a sign that due diligence connected to transactions, refinancing, and redevelopment continues despite a more cautious environment.
Lender appraisals moved in the opposite direction. Volume increased 14% in July, reversing much of June’s 20% decline. The rebound came even as Treasury yields remained near their highest levels of the year, indicating that financing activity may be more resilient than the headline Index suggests.
Buyers Haven’t Left the Market
Perhaps the most important signal beneath July’s decline is that buyer interest remains intact.
LightBox’s Transaction Tracker recorded 1,677 deals closing in June, up 16% from May. Investor engagement on LightBox Live also remained strong. During the second quarter, prospective buyers signed an average of 139 nondisclosure agreements per listing, compared with 133 in the first quarter, across roughly 270,000 listings.
In other words, fewer properties may be coming to market, but investors are still actively evaluating opportunities.
That fits a broader pattern seen in CRE this year: capital has not disappeared, but investors are becoming increasingly selective. In today’s environment, activity is being shaped by borrowing costs, asset quality, market fundamentals, and the ability to underwrite through uncertainty.
As LightBox’s recent Transaction Tracker analysis noted, investors have continued deploying capital despite challenging lending conditions, with a sharper focus on durable cash flow and long-term demand drivers.
A Market Responding to Volatility
July’s decline came against a challenging economic and geopolitical backdrop.
Renewed fighting in Iran pushed oil prices back toward $100 per barrel, while the 10-year Treasury reached 2026 highs before easing amid hopes for progress around Strait of Hormuz shipping. At the same time, the Federal Reserve’s July meeting highlighted uncertainty around monetary policy, followed shortly afterward by a weaker-than-expected employment report.
For CRE professionals, that combination creates a difficult environment for pricing and underwriting. Even without a change in the Fed’s benchmark rate, elevated long-term yields can keep financing conditions restrictive and make investment decisions more difficult.
Yet the market continues to function through those pressures.
Banks are lending, transactions are closing, and buyer interest remains visible. Industrial and data center demand continues to hold up, multifamily is benefiting from a slowing supply pipeline, and office leasing is showing pockets of recovery.
Seven Months In, CRE Looks More Paused Than Broken
Looking across 2026 helps put July’s numbers into perspective.
The Activity Index climbed from 121.1 in February to 129.4 in May before declining in June and July. At 110.7, the Index has returned close to where it stood one year ago. Rather than signaling that activity has fallen sharply below normal levels, the recent decline looks more like a reset following an unusually strong spring.
The next question is whether that reset continues.
If geopolitical tensions and borrowing costs remain elevated, CRE activity could stay under pressure through August. But if oil prices retreat, Treasury yields move lower, and uncertainty around the Middle East begins to ease, the market could respond quickly.
For brokers and investors, July’s numbers reinforce the importance of looking beneath the headline. Listings have slowed, but appraisal activity has rebounded. Due diligence remains above year-ago levels. Buyers are still evaluating deals.
The market may be more cautious, but it remains engaged.
What to Watch Next
August will provide an important test of whether CRE activity stabilizes near current levels or whether the summer slowdown extends further into the third quarter. The direction of Treasury yields, geopolitical developments, incoming labor and inflation data, and Fed expectations will all play an important role.
For now, the signals point toward continued uneven activity rather than a sharp contraction, with the potential for stronger momentum later in the year if financial and geopolitical pressures ease.
Read this month’s LightBox CRE Activity Index for the full analysis, including the latest trends in commercial listings, environmental due diligence, lender appraisals, transaction activity, and the economic forces shaping the CRE market.
For more information about this report or the data, email insights@lightboxre.com
