
February Increases 10% Year Over Year and 2% over January
LightBox’s CRE Activity Index has become a key barometer of market health, aggregating data on property listings, environmental due diligence, and appraisals to deliver a comprehensive pulse on commercial real estate trends. By tracking shifts in the velocity of CRE transactions in any given month compared to another, the Index highlights pivot points in the market, like the early 2022 high and December 2023 low, followed by the gradual recovery last year. The Index is computed as a daily average to account for the fact that some months are shorter than others, but seasonal trends or atypical market shocks can cause the Index to fluctuate, sometimes dramatically, and distort the broader market trend.
Understanding the 12-Month Moving Average for the LightBox CRE Activity Index
To smooth out monthly fluctuations, a 12-month moving average is a statistical tool used to analyze time-series data in which each month’s value is calculated by averaging data points for the most current 12-month period. Observing the LightBox CRE Activity Index, expressed as a 12-month moving average (12MMA), allows for a deeper understanding of the market’s long-term trend by averaging out any short-term volatility due to a monthly spike or decline and focusing on the broader trajectory.
A review of the Index over the past 14 months makes it easier to observe the market’s immediate responses to economic or policy changes:
- Early 2024: The Index started at 76.2 in January, the Index dipped slightly in February then tracks a slow but steady recovery to 93.0 at mid-year.
- Mid-2024: Summer months are typically a bit slower and 2024 was no exception with slight declines in July and August. The Index then rebounded in September to a 14-month high of 98.2, a reflection of the sharp uptick in activity and renewed market confidence following the Federal Reserve’s first interest rate cut of 2024.
- Post-September Rate Cut: Despite two more rate cuts, the uncertainty of the presidential election resulted in an October and November slowdown, followed by an even steeper December decline, due to the combination of typical end-of-year slowness as well as the high degree of market volatility in the wake of the election.
- Early 2025: In the new year, a dramatic uptick in property listings spurred a recovery in the Index to levels just above one year prior followed by even stronger momentum in February as CRE lenders and investors re-engaged to take advantage of new opportunities the market had not seen for much of 2024.
| Comparison of CRE Activity Index with 12-Month Moving Average | ||
|---|---|---|
| Index | 12MMA | |
| Jan’24 | 76.2 | 78.7 |
| Feb | 75.8 | 78.5 |
| Mar | 82.4 | 78.4 |
| Apr | 85.1 | 78.4 |
| May | 86.2 | 78.1 |
| Jun | 93.0 | 78.7 |
| Jul | 92.4 | 79.6 |
| Aug | 89.9 | 80.4 |
| Sep | 98.2 | 81.2 |
| Oct | 95.9 | 82.6 |
| Nov | 80.5 | 83.6 |
| Dec | 56.8 | 84.4 |
| Jan’25 | 80.7 | 84.7 |
| Feb | 96.1 | 86.4 |
Interpretating the 12MMA Index
A review of the Index expressed as a 12MMA reveals the long-term path of recovery, rising 7.7 points over the course of the year, with less notable month-to-month volatility due to economic or political milestones:
- Early 2024: The Index began the year at 78.7 in January and remained relatively stable, showing only minor monthly changes as interest rates remained locked at still-high levels. After a slight dip in April, the Index recovered by mid-year back to January levels.
- Mid-2024: June marked a turning point where market confidence began to build in anticipation of the September interest rate cut.
- Post-September Rate Cut: The Index rose from 82.6 to 84.4 by year-end despite dramatic monthly fluctuations leading up to, and following, the presidential election, a measure of the market’s overall upward trajectory in this sustained recovery period.
- Early 2025: The strong momentum of property listings, CRE lending and investment brought the 12MMA to its highest level since 85.5 in mid-2023, suggesting an overall positive trend reflective of increasing investor confidence and healthy demand for commercial properties.
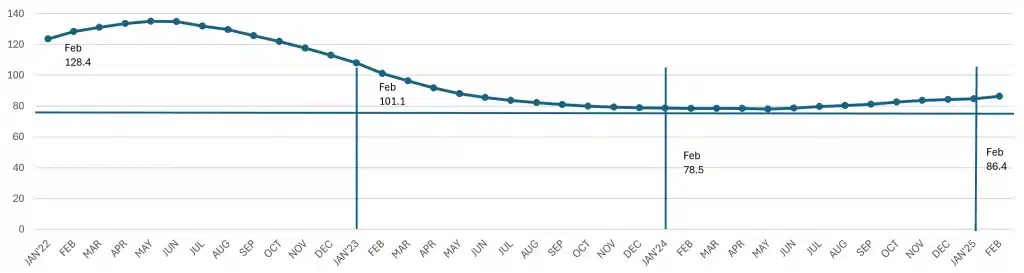
Visualizing the 12MMA CRE Activity Index
Below is the three-year trend line for the LightBox CRE Activity Index, starting with the early 2022 high point and ending with 86.4 in the latest month, February 2025. After the early 2022 market peak, the CRE market’s long-term trajectory has been one of a decline to the late 2023 low point after 11 interest rate increases, followed by a plateau and then a mid-2024 transition to a gradual recovery path.
LightBox CRE Activity Index
12-month Moving Average (2022-Present)
Interpretations and Implications for Lenders and Investors
The 12MMA allows observers to focus on underlying trends by reducing the impact of short-term monthly fluctuations. As an early indicator of the overall strength or weakness of the CRE market, the CRE Activity Index is an important barometer to watch in today’s recovery period. A pivot point in the Index could trigger market entry and exit points for investors based on whether capital is mobilizing to take advantage of opportunities during periods of higher confidence or retreating to the sidelines during times of market uncertainty.
Forecast for 12MMA: 95 to 100 Range by Year-End 2025
Looking ahead, the CRE Activity Index’s 12MMA is expected to increase slightly in the first half of 2025 as broad signals point to investors showing a willingness to deploy capital and the loosening of debt-side purse strings as banks originate loans meaningfully for the first time in several years. An increase in property listings over the course of 2025 will trigger demand for the environmental due diligence and appraisal activity that supports transactions and contribute to upward momentum in the Index.
By the second half of 2025, barring any significant weakening of the U.S. economy or labor markets—or stagflation as the result of the trade war—and assuming one or two more interest rate cuts by the Fed, the 12-month moving average for the year will land in the 95-100 range as investment and lending volume continues to recover and new assets enter the market, either through forced sales or more typical transfers of ownership, according to the 2025 LightBox Predictions Report. The forecast charts the Index on a path of gradual recovery that brings investment and lending volumes closer to 2019 volume than the early 2022 high water mark of record-low interest rates.
LightBox CRE Activity Index
12-month Moving Average (2024-Present)

The 12MMA is an alternate way of analyzing and interpreting trends in the LightBox CRE Activity Index by smoothing out any monthly fluctuations due to seasonality or market impacts from dramatic policy changes or factors that could impact sentiment materially to focus on the broader, longer-term trend. By incorporating the 12MMA into LightBox’s CRE Activity Index, investors, developers, and policy makers can better understand market dynamics and position themselves to respond to any shifts at this time of great uncertainty. As the market continues to adjust to rapidly changing federal policies and closely watches metrics on inflation, the labor market, and others for any signs of weakening in the U.S. economy, the 12MMM will be an important indicator to gauge the extent to which any broader shifts in the economy are impacting the pace of recovery in the CRE market.