
Conservative start gives way to (very) cautious optimism as deal flow grows
The investment climate for capital markets in commercial real estate (CRE) began the year with trepidation. After 18 months of falling values, wide bid-ask spreads between buyers and sellers, and higher operating costs, caution was the operative word heading into 2024.
Q1 2024 brought anecdotes of economic activity beginning to inch up. But buyers and sellers were looking for more tangible evidence. Some of that statistical evidence is starting to appear, offering some modest indications that CRE velocity is increasing. As expected, property listings brought to market on the LightBox RCM platform in Q1 2024 were considerably higher than the those listed in Q4 2023. Total property listings in the platform were up 44%; however, the change is essentially flat when comparing to the same quarter in 2023.
Sentiment from our CRE clients varied depending on their asset focus and location. For office and industrial professionals, the mood remains uncertain and subdued. The news that the Fed is pushing off rate cuts is one of the biggest contributing factors. At the start of the quarter, analysts were expecting six cuts this year. Now, some economists are saying rate cuts may not happen until later in the year, if at all.
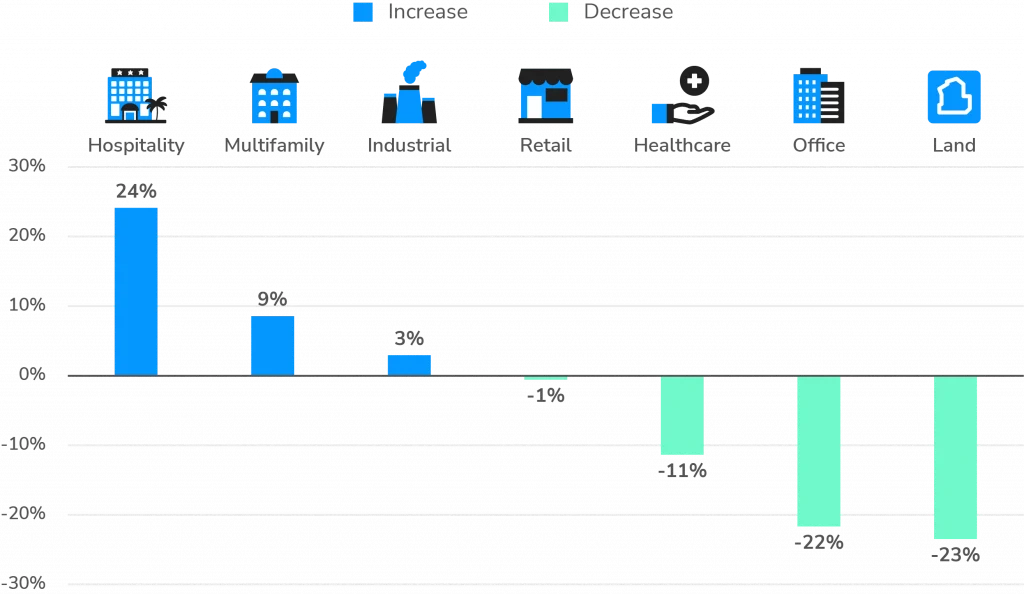
On the other hand, the multifamily, industrial and hospitality sectors are showing signs of life. Year-over-year; hospitality, multifamily, and industrial all saw growth in total number of listings on the LightBox RCM platform, with hospitality up 24%, multifamily up 9% and industrial up at 3%.
Key highlights:
- While these possible signs of recovery are encouraging, the market remains unpredictable, and investors eager to reenter are still exercising caution. The LightBox CRE Property Listings Index saw a significant rise from a low of 69 in Q4 2023 to nearly 100 in Q1 2024. Compared to the same quarter in 2023, the Index showed a was essentially flat going from 100.2 to 99.8.
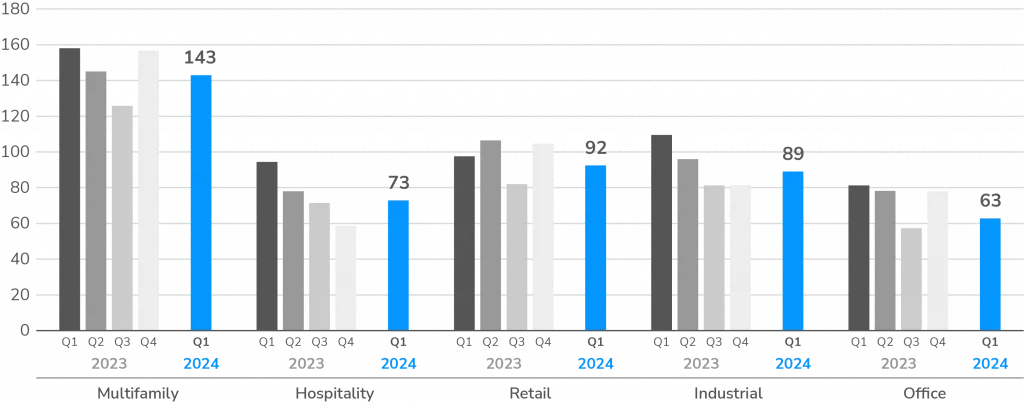
- The average number of non-disclosure agreements (NDAs) per listing – a key measure of demand – decreased slightly in the first quarter to 99 but still maintained close proximity to the 2023 average of 105.
- Hospitality listing volumes nearly doubled from the end-of-year slowdown and investor interest in the sector saw a dramatic increase, up 20% from last quarter. The number of NDAs in this sector jumped to 73 in Q1 2024, up from the average of 58.
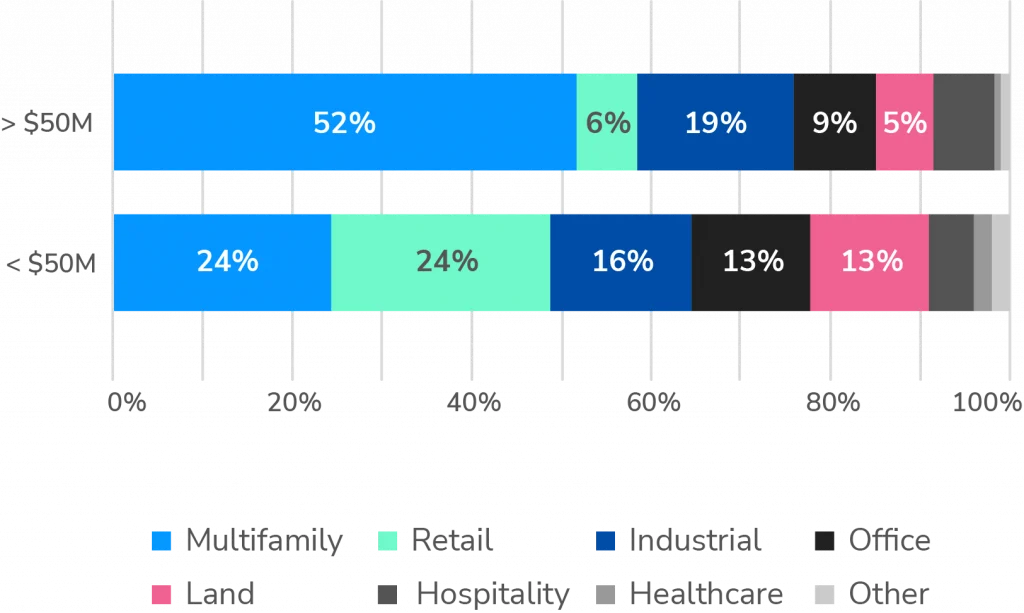
- Private capital continues to fill the void while institutional investors are still exercising caution on the sidelines. LightBox RCM listings priced below $50 million reached over 80% of overall deal volume in the first quarter. Multifamily and retail account for approximately 50% of these deals.
“Capital is continuing to form on the sidelines, waiting for its opportunity to pounce once it perceives pricing capitulation. Institutional investors are still playing it safe, weary of the stalled Fed rate cuts. This caution has created a notably sober atmosphere, yet private capital investors have filled the void, accounting for 60% of all 2023 transaction activity.”
Chris Toci, Executive Vice President, Capital Markets, Cushman & Wakefield
LightBox CRE Property Listings Index Q1 2024
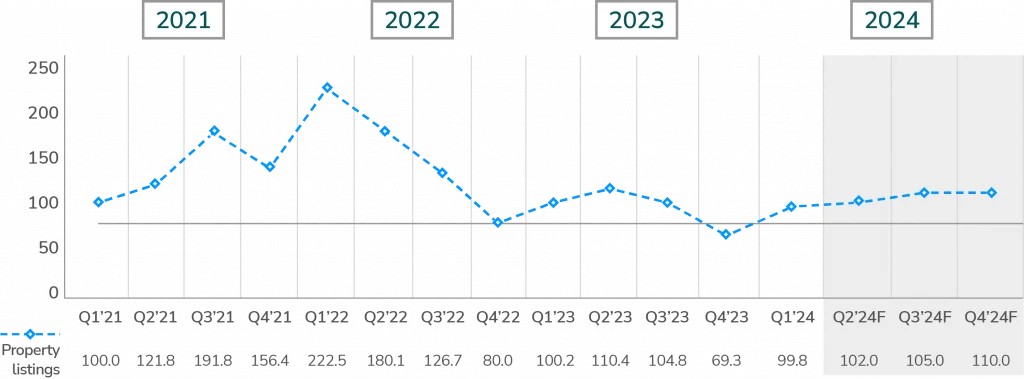
NOTE: The LightBox CRE Property Listings Index is derived from data in the LightBox RCM® platform used by brokers/investors. Quarterly volumes are normalized to a Q1 2021 base (and adjusted as necessary for changes in client mix to highlight organic market trends). This index is one of three indexes that feed into the LightBox CRE Index, an aggregate activity index that represents a composite measure of movements across activity in appraisals, environmental due diligence, and commercial property listings as a barometer of broad industry shifts in response to changes in market conditions.
Overall, the LightBox CRE Property Index rose from 69.3 in Q4 of 2023 to hit 99.8 in Q1 2024. The Q4 2023 reading represented an all-time low for the index which goes back to 2021.
While the Q1 jump is impressive, there are some caveats. Q4 is historically a slow quarter, so there is often a sizable jump in Q1 every year. However, the 30-point uptick is substantially higher than the 20-point jump between Q4 2022 and Q1 2023. The Q1 2024 number is almost identical with the index reading from Q1 2023 (the Q4 2023 downturn was deeper than the Q4 2022 drop off).
If it feels like recovery is slow to come, it’s likely because the market was so robust in 2022. The Index peaked at 222.5 in Q1 2022.
These results are consistent with the latest quarterly LightBox CRE Activity Index, which showed that activity increased quarter over quarter as well. Similarly, that was consistent with Property Index in that it was slightly weaker than one year ago.
LIGHTBOX RCM PROPERTY LISTINGS BY ASSET CLASS
Multifamily continued growth with modest gains for office sector
An analysis of property listings in the LightBox RCM platform highlights changes in overall volume, as well as a telling snapshot of the types of assets that were brought to market in Q1 2024.
The total volume of property listings in the LightBox RCM platform increased by 13% in Q1 2024 compared to Q1 2023. Year-over-year, hospitality, multifamily, and industrial all saw growth in the total number of listings.
Breakdown of Property Listings on LightBox RCM by Asset Class (Q1 2024)

Multifamily represented nearly one-third (32%) of the total listings brought to market while the office sector made small gains increasing from a low of 11% last quarter up to 14% in Q1 2024. Hospitality nearly doubled its number of listings from the fourth quarter and increased by 24% from last year at this time. The uptick in hospitality listings is encouraging since that sector has been the slowest to recover from the pandemic.
Change in LightBox RCM Property Listings by Top Asset Class (Q1 2024 vs. Q1 2023)
INVESTOR ENGAGMENT
Multifamily, industrial and retail hold steady
One key measure of investor interest is the number of NDAs executed per listing. While we saw investors spending more time reviewing deals last quarter, institutional investors were cautious coming out the gate in 2024. At an average of nearly 100, the first quarter of 2024 was conservative but not far from the average 2023 level of 105.
Average No. of NDAs Executed per LightBox RCM Listing (2023-2024)

The LightBox RCM data also showcases property types with the highest level of investor engagement. Multifamily, industrial, and retail all saw continued interest. The most notable was the hospitality sector, which saw a combined increase in total volume, as well as higher interest from the RCM database of buyers. Both of these indicators suggest signs of recovery in travel and hotel demand.
Property Types with Highest Investor Engagement Based on Average Volume of NDAs Executed (2023-2024)
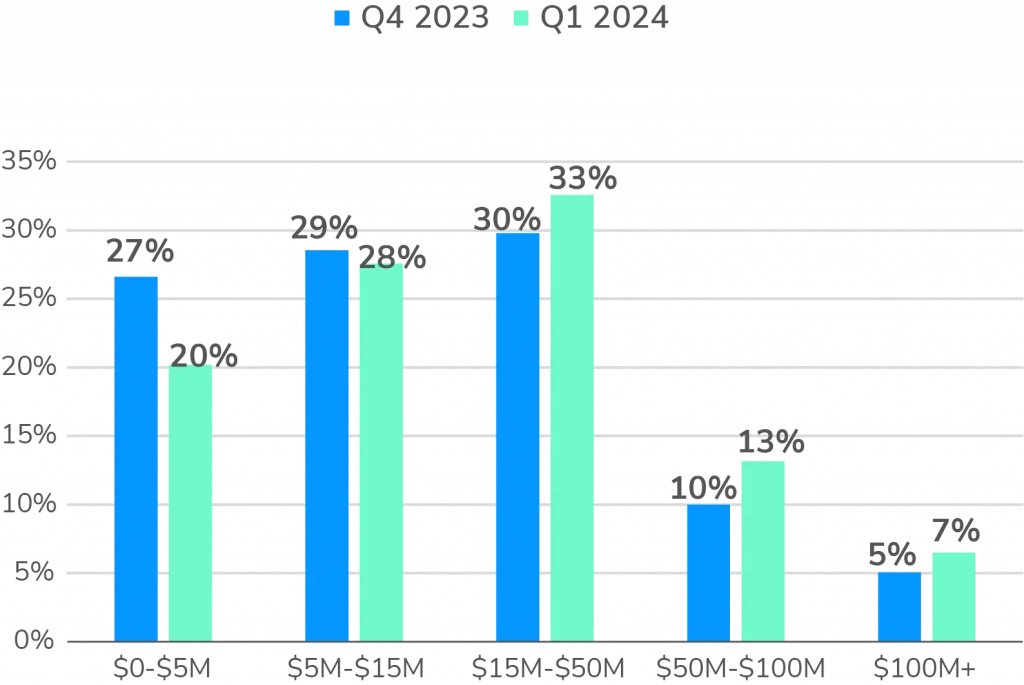
80% OF ASSETS BROUGHT TO MARKET ON LIGHTBOX RCM WERE PRICED BELOW $50 MILLION
Non-institutional investors continue to be active within the market
By property type, the listings with asking prices above $50 million were primarily accounted for by multifamily (24%) and retail (24%). With nearly 50% of total listings priced below $50 million, non-institutional and private capital investors, made up of primarily family office and private wealth management groups, continue to allocate their portfolios towards real estate direct investments.
“In today’s stalled market, we are discovering innovative avenues to navigate challenges. We marketed a 400,000-square-foot, single-story back-office portfolio, which is a challenge to move in today’s market, and broke it up into smaller parts, that attracted 1,031 buyers. Not only did we exceed our BOV projections, but this highlighted the reality that the collective value of each part, in many cases, far exceeds the original whole.”
Chris Toci, Executive Vice President, Capital Markets, Cushman & Wakefield
Overall, listings brought to market in Q1 were predominantly priced below $50 million; however, listings above $50 million in multifamily, industrial and office increased from 15% to 20%. This is believed to be in part due to the increase in portfolio sales.
Assets Brought to Market on LightBox RCM Below & Above $50 Million by Asset Class
(Q1 2024)
Breakdown of LightBox RCM Property Listings
by Asking Price (Q1 2024 vs. Q4 2023)
2024 FORECAST
Anticipating CRE Market Rebound Amidst Challenges: A Tale of Two Markets
Early signs of increased transaction activity, despite lower volumes, are popping up across the country. In fact, this CRE recession has been a tale of two markets. For the industrial, retail, and hospitality sectors, this downturn has been relatively mild. While values are down, this can be attributed to higher interest rates that have pushed caps rates up and prices down; this distress has been relatively light compared to past crises. At the first sign of falling rates, these sectors should see prices firm up and activity rebound.
The office and multifamily sectors are not faring as well. The situation in the office market is more appropriately labeled a depression. Seemingly permanent behavioral changes from COVID along with falling demand from big tech have put this market on ice.
In the multifamily segment, the distress is almost completely a function of value-add buyers/syndicators using short term floating rate debt and suffering the ramifications once rates shot up. Were it not for the use of floating rate debt, the multifamily segment would probably look a lot like industrial, retail, and hospitality.
Interest rates are likely to remain high for the near-term, but we expect moderate increases for the LightBox CRE Property Listings Index over the next two quarters as sellers become more comfortable testing the waters amidst the absence of substantial rate cuts. The mantra of “More in ‘24” has shifted back to “Survive until ‘25” as all eyes remain on the Fed. A few interest rate cuts would go a long way to helping those sitting on floating rate debt and would give a boost to market confidence.
But the best news right now is that cycles don’t last forever; that we are well into the cycle that began in June 2022; and the next move for interest rates will be lower (we hope). The combination of those should make the H2 2024 better for lenders, owners, and brokers, and should set the market up for a nice bump in 2025.