
One way to simplify our complex, data-driven world, is to figure out how to easily summarize and digest the large amounts of information that come our way each day. For example, we have rating systems for everything from restaurants to movies, to cars and even homes. Instead of providing ratings for specific characteristics, we often condense our opinion into a single score that encapsulates a number of different factors.
But how are these ratings or ‘scores’ calculated?
Yes, many times our systems of ratings are subject to knee-jerk reactions and are often skewed by difficult to quantify factors such as our feelings on a given day, our bias towards individuals or companies, or even the opinions of our friends and family (just think of any online restaurant reviews). Consequently, there needs to be a way to limit bias from these ratings/scores, and to come up with a consistent and easy method to formulate them.
Enter: Weighted Scoring Models.
Essentially, think of these scores as indexes. They are made up of a number of different criteria. Based on what the score is trying to communicate, each criterion is applied a different weight. This weight will determine the level of the criterion’s influence on the overall score. Often, these models are applied in the financial services/insurance industries to determine ‘risk levels’ for a given feature (e.g. home, neighbourhood, individual).
Risk scoring models and the statistics that drive them are very important because they establish a consistent, and calculated a way to evaluate risk. Without a scientific method to measure the probability of say, a flood at a specific location, it would make it very difficult for companies insuring homes to confidently build their portfolios to a ‘tolerable’ level of risk.
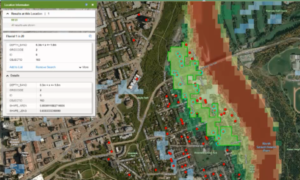
Figure 1: Addresses falling in a flood zone; flood risk is often a criterion that is included in risk models[/caption]
You can apply this same concept to ratings such as neighborhood scores as well. These are often used to communicate to prospective buyers a home’s relative proximity to important features (e.g. schools, transit, shopping centres, etc.). The higher the score, the ‘better’ the neighborhood.
In order to fully grasp the idea of weighted scoring, let’s try to take this concept and apply it to our own “neighborhood score” below. We can start by selecting the criteria that we will use to build the score:
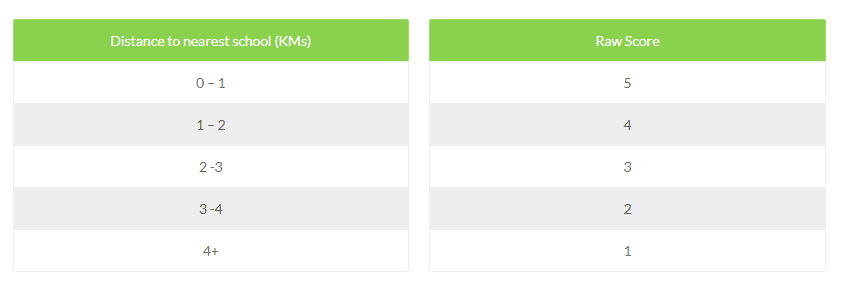
- Proximity to Schools: The closer the home is to the school, the better
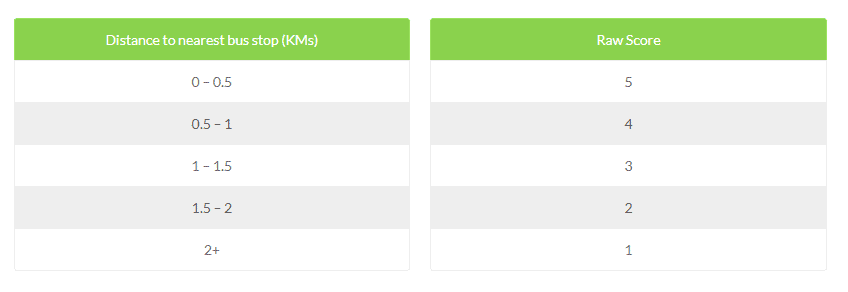
- Proximity to Public Transit: Being close to public transit is important because it allows easy access to many different amenities
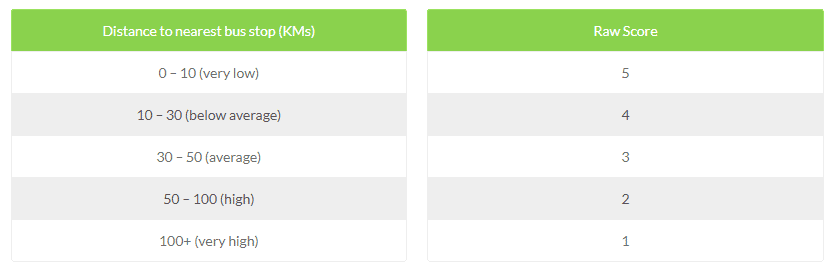
- Crime: It is very important to be in an area free of crime
Based on the above information, the next step is to assign weights to each criterion (Note: the weights should add up to 100%):
- Proximity to Schools: 25%
- Proximity to Public Transit: 30%
- Crime level: 45%
Now that the weights have been determined, we need to assign a raw value/score to each of the criterion (such as distance intervals):
25% Weight
35% Weight
45% Weight
Now, let’s say the home in question is:
- 2.2 KM from the nearest school
- 0.3 KM from the nearest bus stop
- located in an area of high crime rates
If we substitute the raw score value for each criterion into the below equation, we achieve an overall score for the home.
3(0.25) + 5(0.3) + 2(0.45) = 3.15 -> out of 5
Depending on the organization’s/individual’s tolerance, a score of 3.15 maybe be considered below, or above average (totally dependent on the situation).
Obviously, the above example is highly simplified. Organizations undergo multiple iterations of score generations, with various combinations of criterion, in order to come up with the most meaningful score to them. For example, when evaluating the neighborhood score of a home, a different company may consider proximity to schools as the most important buying feature (instead of the level of crime in the area). They would then modify the weight, and tailor the score to suit their needs.
Often, the problem of creating these scores it outsourced, and the work is done by a third party. In some cases, companies may lack the expertise to build these models or simply not have access to the data (criteria) required to produce a meaningful score. More and more, companies such as our own (DMTI Spatial), are being employed to build models based on client requirements.
The screen shots below show a simple interface where users can search for an address in a map, and generate a ‘risk score’ based on that home’s location. Higher the risk, the less likely the home will be insured.
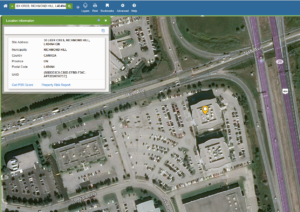
Figure 2: Searching for an address and generating a property report

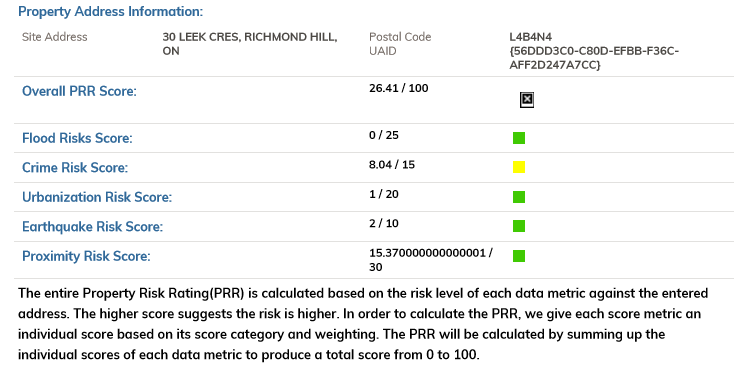
Figure 3: Property report built based on environmental risk factors
Wrap up: Benefits of weighted scoring models
The concept of weighted scoring models is a relatively simple one and they provide many benefits:
- These models are often highly customizable
- They are consistent and have limited bias (obviously there may be some bias based on who is actually building the score; for example, one person may believe that proximity to schools is more important than proximity to bus stops)
- These models can be applied across very large datasets. For example, a company can run a weighted risk model on its entire portfolio and can expect a consistent and measurable result across the board.
- The can quickly provide a meaningful score based on many different types of input data from which educated business decisions can be made
Should you wish to learn more about how your company might make use of these models, or data used to generate them, please contact LightBox today