
LightBox CRE Activity Index rises 9% to 129.1 as commercial property listings surge, while environmental due diligence and lender appraisals lose momentum.
The commercial real estate market entered the final quarter of 2026 with renewed activity, but the latest data reveal a market moving at two different speeds.
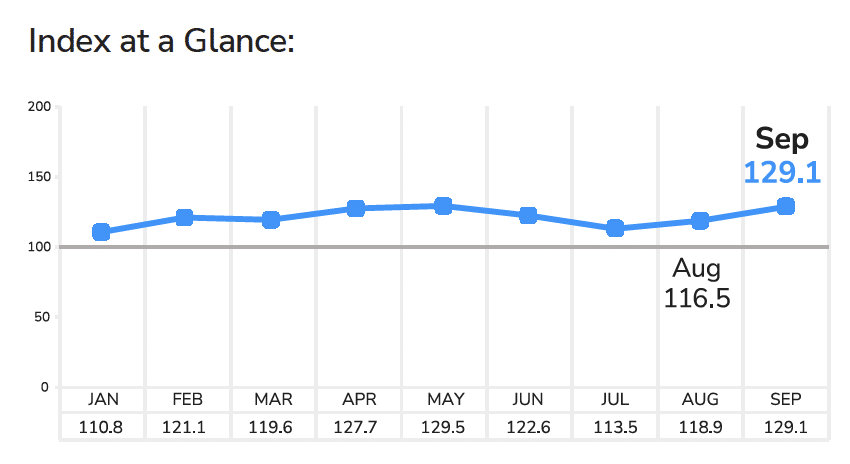
The LightBox CRE Activity Index rose 9% in September to 129.1, up from 118.9 in August and just below May’s year-to-date high of 129.5. The increase signals a meaningful rebound following the summer slowdown, even as higher interest rates and economic uncertainty continue to challenge the market.
But the headline increase masks an important divergence. Commercial property listings surged 24%, while Phase I Environmental Site Assessments (ESAs) declined 5% and lender-driven appraisals fell 13%.
The result is a growing disconnect between properties entering the market and the financing and due diligence activity needed to move transactions toward closing.
September’s CRE Activity Index: Three Signals, Three Different Directions
September’s Index reflects activity across three important stages of the commercial real estate transaction lifecycle: property listings, environmental due diligence, and lender appraisals.
Each tells a different story about current market conditions.
Commercial Property Listings Jump 24% as Sellers Return
Following three consecutive months of declines from May through July, commercial property listings increased for the second straight month in September.
The 24% monthly gain pushed listing activity 32% above September 2025 levels, suggesting that more owners are bringing commercial properties to market as the year draws to a close.
That increase is an encouraging sign of seller engagement, but it does not necessarily indicate stronger buyer demand or improving transaction conditions.
Some property owners may be responding to uncertainty around borrowing costs, choosing to market assets now rather than face potentially more challenging financing and pricing conditions later.
Regardless of motivation, the increase in listings could create additional transaction opportunities heading into Q4. The critical question is how many of those opportunities will advance beyond the listing stage.
Phase I Environmental Due Diligence Activity Declines 5%
While listings accelerated, Phase I ESA activity declined 5% in September, reversing August’s modest 3% increase.
Activity remained approximately even with the same period last year.
Because environmental due diligence is closely tied to acquisitions, refinancings, originations, and distressed transactions, changes in Phase I ESA volume provide another perspective on the health of the CRE transaction pipeline.
September’s decline suggests that the increase in properties being marketed has not yet translated into comparable growth in transactions advancing through due diligence.
Lender Appraisals Fall to Their Lowest Level of 2026
The most pronounced weakness came from lender-driven appraisals, which declined 13% in September.
It was the second consecutive monthly decrease, bringing appraisal activity to its lowest level of 2026.
Lender appraisals provide an important signal of financing activity. Their decline suggests that higher borrowing costs and uncertainty around valuations continue to weigh on acquisitions and refinancing decisions.
Together, the three indicators illustrate the central tension facing the market: more properties are entering the transaction pipeline, but fewer appear to be progressing through the financing-dependent stages at the same pace.
A September Rebound, but Below Historical Trends
The September increase also needs to be considered in the context of typical seasonal activity.
Over the past six years, the LightBox CRE Activity Index has increased an average of 12% between August and September as market participants return from the summer slowdown and transaction activity accelerates.
This year’s 9% gain fell short of that historical average.
The difference is especially notable given the interest rate environment. In September 2024 and September 2025, the Federal Reserve initiated rate cuts, and the Index increased 12% and 11%, respectively.
September 2026 brought a different backdrop, with the Fed raising rates by 25 basis points and the 10-year Treasury yield climbing above 5%.
The fact that the Index still advanced demonstrates continued market activity, but its composition suggests that elevated financing costs are having an uneven impact across the transaction lifecycle.
CRE Transactions Continue Despite Financing Headwinds
Despite signs of weakness in financing-related activity, commercial real estate transactions have not come to a standstill.
Preliminary data from the LightBox Transaction Tracker recorded 1,683 September closings, compared with 1,803 in August. With additional September transactions still being captured, activity remains near the approximately 1,700 monthly closings recorded in June and July.
Capital also remains available across banks, life insurance companies, CMBS lenders, and nonbank financing sources.
The challenge is increasingly less about whether capital exists and more about whether individual transactions can meet today’s underwriting requirements.
Elevated interest rates can create larger refinancing gaps, complicate negotiations between buyers and sellers, and make it harder for properties to support the cost of debt.
As a result, activity is becoming more selective, with property fundamentals, pricing expectations, and local market conditions playing an increasingly important role in determining which transactions move forward.
What September’s CRE Activity Index Means for Q4
As the commercial real estate industry enters the final months of 2026, September’s results offer both reasons for optimism and signals of caution.
Two consecutive months of increasing listings suggest that property owners are re-engaging with the market. That additional inventory could support transaction activity through year-end and into 2027.
However, declining environmental due diligence and appraisal volumes suggest that the market may struggle to convert that inventory into completed transactions at the same pace.
Three developments will be particularly important to watch:
- Whether listing growth translates into stronger due diligence activity. A rebound in Phase I ESA volumes could indicate that newly marketed properties are beginning to move into the next stage of the transaction process.
- Whether lender appraisal activity stabilizes. A recovery in appraisals would offer evidence that acquisition and refinancing activity is gaining traction despite higher borrowing costs.
- Whether transaction closings maintain their pace. Continued deal activity would demonstrate that buyers, sellers, and lenders are finding workable economics even in a more challenging rate environment.
The September data do not point to a stalled CRE market. They point to one in which activity is increasingly uneven.
The defining question for Q4 is whether the renewed supply of properties coming to market can translate into completed transactions.
For now, sellers appear ready to engage. The next signal to watch is whether buyers and lenders can keep pace.
About the LightBox CRE Activity Index
The LightBox CRE Activity Index provides a monthly measure of commercial real estate market activity based on changes in commercial property listings, Phase I Environmental Site Assessments, and lender appraisal activity.
The Index is benchmarked to a Q1 2021 monthly average of 100 and normalized for differences in business days per month, offering insight into how the commercial real estate transaction pipeline responds to changing market conditions.
Read the September 2026 LightBox CRE Activity Index for the full analysis of commercial property listings, Phase I environmental due diligence, lender appraisals, transaction activity, and the economic forces shaping the CRE market.
Frequently Asked Questions
What does the September 2026 CRE Activity Index reveal about the commercial real estate market?
The LightBox CRE Activity Index rose 9% to 129.1 in September 2026, reflecting renewed market activity following the summer slowdown. However, the increase was driven primarily by a 24% surge in commercial property listings. Phase I Environmental Site Assessment activity declined 5%, while lender appraisals fell 13%. These contrasting trends suggest that more properties are entering the market, but financing and due diligence activity are not keeping pace.
What do declining commercial real estate appraisals mean for the transaction pipeline?
Declining lender appraisal volumes can signal slowing acquisition financing and refinancing activity. In September 2026, lender appraisals fell 13% to their lowest level of the year, even as commercial property listings increased. This divergence suggests that higher borrowing costs and underwriting challenges may be limiting how quickly properties advance from listing to closing. If appraisal activity remains weak, transaction timelines could lengthen despite an increase in available properties.
For more information about this report or the data, email insights@lightboxre.com
