
In February each year, millions of Americans settle in to enjoy the Big Game, one of the most watched sporting events on television, broadcast in more than 130 countries in more than 30 languages. This year, the battle between the Kansas City Chiefs and the Philadelphia Eagles will take place at State Farm Stadium in Phoenix, Arizona, home to the Arizona Cardinals, the annual Fiesta Bowl, and concerts, trade and consumer shows and corporate and special events.
This year, LightBox decided to look at the city hosting the Big Game through the lens of our data. What follows are key points of interest.
Phoenix is in the Super Sun Belt, a region that stretches across multiple states in the Southeast and Southwest and includes major U.S. cities such as Atlanta, Dallas/Fort Worth, Houston, Miami and Tampa. It houses about half the national population and has seen huge growth during the past decade.
Phoenix has a population of 5.12 million, with projected annual growth of 1.6 percent. Its top two market advantages are its growth demographic and a business-friendly environment. High inflation is a concern—the city saw year-over-year price growth of 12.3 percent in June, compared with 9.1 percent nationally—as are the effects of climate change, which creates a heat island effect, according to LightBox data.
Phoenix is a Top 10 Ranked Real Estate Market, and No. 9 in U.S. Markets to Watch, according to Emerging Trends in Real Estate®2023 report by PwC and the Urban Land Institute (ULI). For homebuilding prospects, it’s No. 13 in Markets to Watch, and is No. 16 for Retail Investment. Based on 2022 data from the EDR/LightBox ScoreKeeper model, Phoenix is No. 10 in the U.S. in the category of Top 10 Largest Phase I ESA Markets and the fifth fastest-growing metro area for Phase I ESAs, with 26 percent growth compared to the U.S. average of 15.5 percent in primary metro areas.
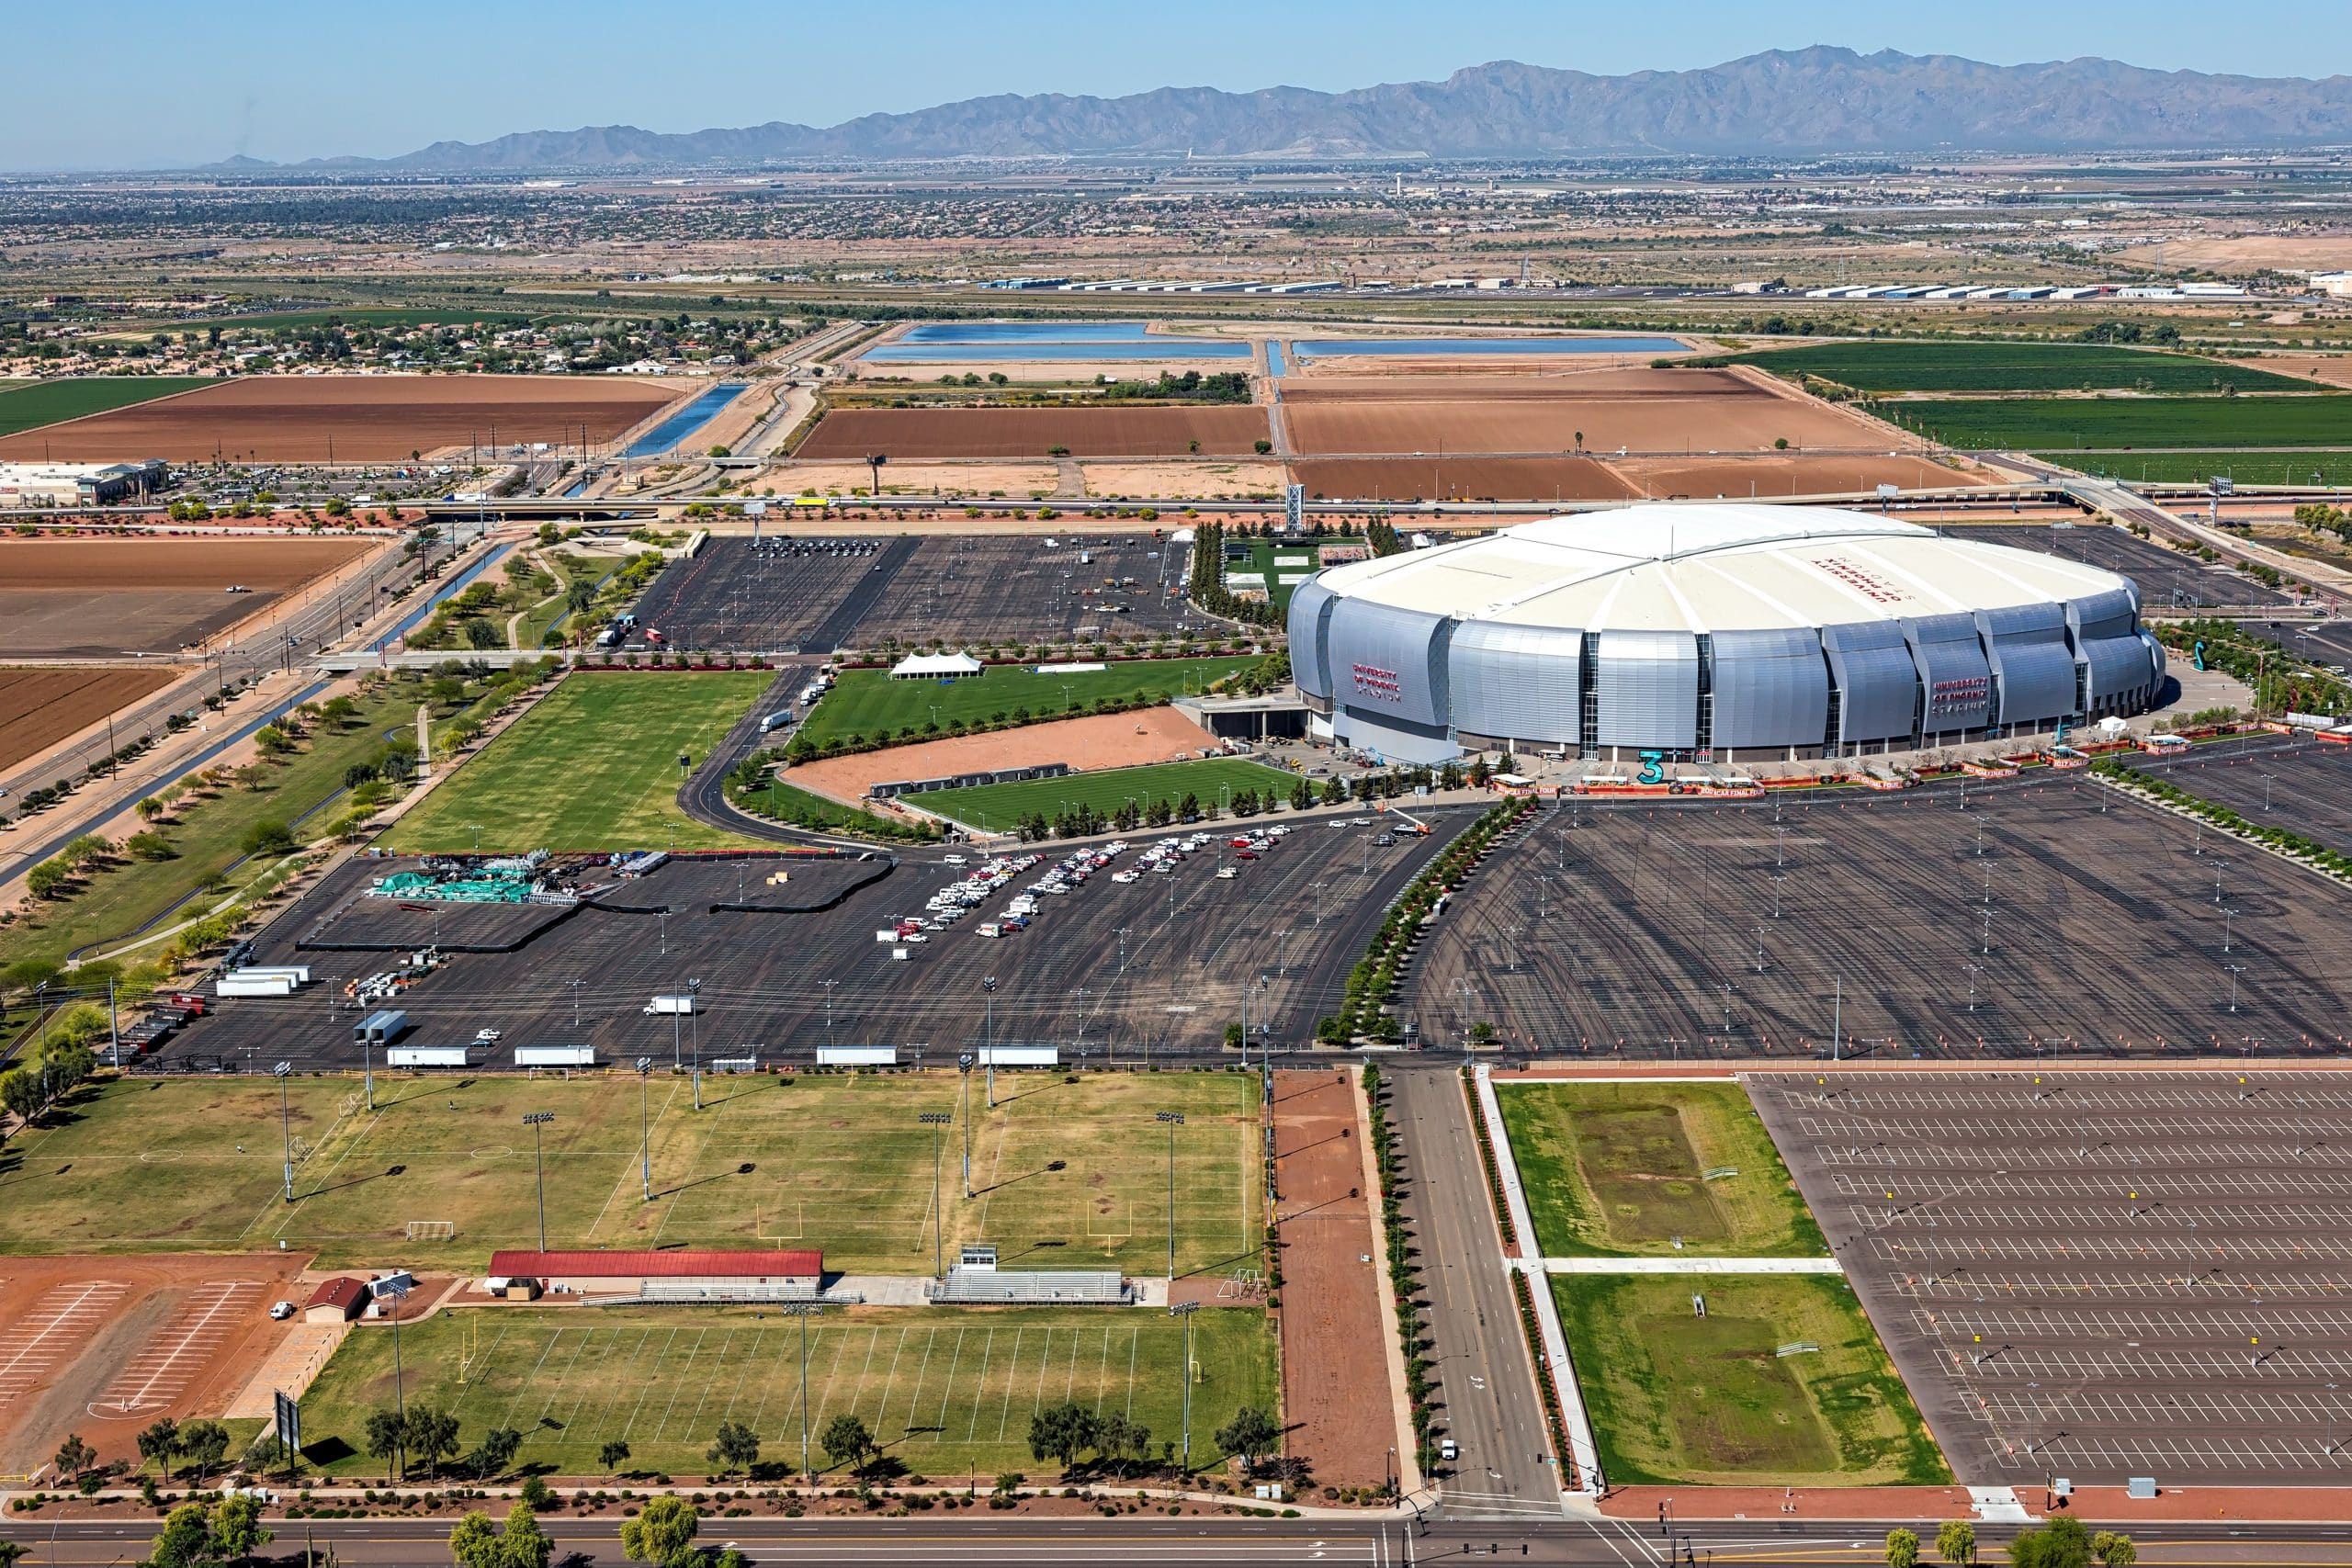
Built in 2005, State Farm Stadium is located in Glendale, AZ (9 miles northwest of downtown Phoenix) in the Phoenix-Mesa-Scottsdale metropolitan statistical area (MSA). Covering more than 25 acres, it has a capacity of 63,400 people (extended to 73,000 for the Big Game) and a total assessed value of more than $108 million.
Commercial Real Estate Data for Phoenix from LandVision and RCM
Below are some key datapoints for the Phoenix metro area:
- More than 800 real estate loans are coming due during the next 12 months within a three-mile radius of the stadium
- More than 830 commercial properties totaling over 1.85 million square feet were sold during the past 12 months within that radius
- Among commercial properties in the Phoenix MSA listed in the LightBox RCM database, the city is ranked in the top five for the number of investor confidentiality agreements (more than 36,000) executed in 2022
- Nearly 500 projects were listed in RCM that year with the top three asset types including: multifamily, industrial and retail, comprising nearly 75 percent of the total
- There are currently around 20,000 qualified investors interested in buying CRE in the Phoenix MSA
Based on output from the EDR/LightBox ScoreKeeper model:
- Phoenix was the 10th largest market for Phase I ESAs in the U.S. in calendar year 2022.
- Environmental site assessments were conducted on more than five thousand properties in the Phoenix MSA last year
- Phoenix was the fastest-growing Phase I ESA market in the U.S. during the past eight quarters, outperforming the U.S. average by 11 percent
Appraisal fees and assignments data from Collateral360
The dollar amount of appraisal fees awarded is down year-to-date and year-over-year by 60 percent, and the number of awards is down by 54.2 percent.
Percentage of awards by property type:
- Industrial: -2.3%
- Office: -13.8%
- Retail Commercial: -7.2%
- Shopping: + 7.0%
- Multifamily: +15.5%
Assignments
- The number of LightBox banks awarding assignments has decreased by 35 percent.
- The response rate has increased by 10.4 percent because fewer request for proposals are being sent out.
- There has been a heavy decline of 30 percent in fees of $4,000+ and a 26.7 percent increase in fees from $3,000-3,999.
LightBox Scorecard
The LightBox Big Game Scorecard compares the final two cities sending teams through a matrix of leading commercial real estate statistics. In the matrix, each quarter is dedicated to a specific focus area: Market Activity, Appraisal, Geometry and ESG/Environmental Justice. In quarters 1 and 2, the three metrics are each worth 3 points, and in quarters 3 and 4, each is 7 points. Based on our analysis, LightBox’s prediction of this year’s Big Game winner is:
Phoenix is a thriving city, with great places to eat and a weekly, bustling farmers market. In addition to restaurants and the city’s baseball and basketball stadiums, there are several new music venues, part of a burgeoning music scene that features local and visiting artists. Football fans coming for the Big Game might consider sticking around afterwards to explore what Phoenix has to offer.
If you want to learn more about a state, metro area, or development, reach out to a LightBox rep to find out how our data can provide everything from a basic overview to a detailed, granular picture based on whatever criteria you want.