

- Investor engagement saw a year-over-year increase in Q3 2023, driven by heightened interest in the industrial, multifamily and retail sectors.
- Q3 2023 saw a rise in properties listed below $15 million, indicating a potential shift towards smaller, more resilient opportunities. Retail, constituting nearly 30% of deals in this price range, emerged as an attractive investment option.
- Large-sized properties in the $50 million to $250 million range, particularly multifamily, remained relatively stable year over year. LightBox RCM transaction volume saw a decrease of 17% in Q3 2023, reflecting ongoing market uncertainty, especially in the office property sector.
In a quarter headlined by high interest rates and military conflicts in both Ukraine and the Middle East, it’s no surprise much of the capital markets industry has a “stand back and watch” attitude. A review of LightBox RCM’s Q3 2023 RCM activity reveals some interesting trends in how the market is responding to these macro forces. Third quarter trends in 2023 were markedly different than last year’s. For a refresher, check out our Q3 2022 RCM transaction activity and then keep reading for some of the highlights from this year.
LightBox just launched the new CRE Activity Index, a composite of three activities that support commercial property dealmaking: property listings on the RCM platform; environmental due diligence activity from the LightBox EDR ScoreKeeper model; and appraisal volume from the LightBox RIMS/C360 platform. In Q3, the LightBox CRE Activity Index, which is anchored to a Q1 2021 baseline, stands at 85.5 for Q3 2023, just below 88.3 in the prior quarter and well below its 130.6 high point in Q3 2021. Given that the three components are all leading indicators of CRE dealmaking, future quarterly trends will be important to watch for early signs of a market beginning to pivot.1
Investor Interest and Engagement Climbed
Year over year, the average number of non-disclosure agreements executed by investors increased in Q3 2023 to 91 (up from 82 last year), with the top three drivers of this rise being the industrial, multifamily and retail sectors. So, what’s driving this surge in a key measure of demand?
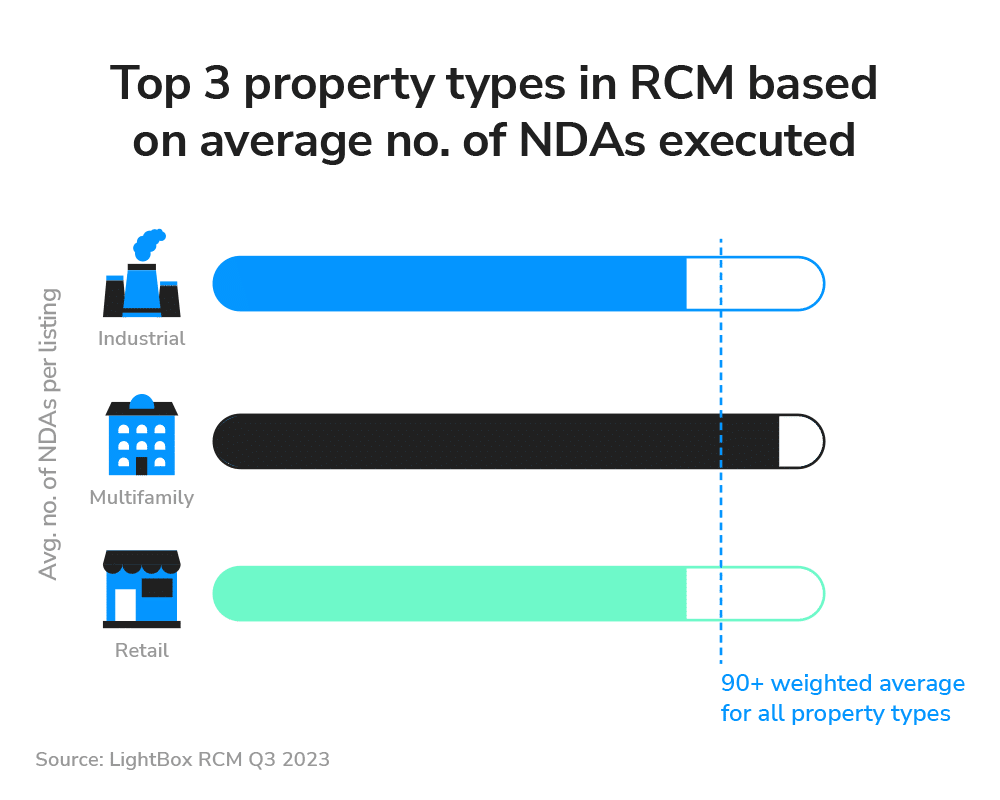
In the industrial sector, growth is steady, albeit at a slightly slower pace than in multifamily and retail. Investor interest continues to be high, driven by the need for distribution and storage facilities that support ecommerce, data storage and more recently, the surge of interest in electric vehicles. With many states adopting various forms of EV mandates, there is demand for real estate that supports vehicle charging stations, battery manufacturing and storage, and more.
Meanwhile in the multifamily sector, investors are drawn to one of its distinct characteristics – the availability of assumable debt on many assets that keeps interest costs relatively low. This has led to a more resilient pricing environment than we’ve seen in other industries. Most notable, however, are the ongoing housing shortage in the U.S. and cooling rental prices – both of which make multifamily an attractive prospect for investors looking to address the housing crisis.
Retail, which has experienced its own set of challenges throughout the past decade, has undergone somewhat of a repositioning and renewal. Shopping centers – especially those in high population centers – are performing better than the mall sector. The post-pandemic trend of remote work keeps people closer to home, which has boosted demand for retailers like gyms, grocery stores and fast food in suburban areas.
We’re also finally seeing in-person retailers distinguish themselves from online competitors, with a focus on creating experiences for consumers that are “unique and memorable.” This, coupled with a post-pandemic bounce back, has created appealing investment opportunities.
LightBox RCM Private Capital Listings Increased
In addition to differences in asset class, a review of LightBox Q3 2023 RCM activity revealed an increase in listings under $15M (from 42% to 45% year over year). This is perhaps an early sign that private capital may be bouncing back, as lower priced deals in the market today are seeing plenty of buyer activity. With changing consumer behaviors, retail may be leading the way to ‘normalcy’, as nearly 30% of the retail listings taken to market via RCM were in this price bracket.
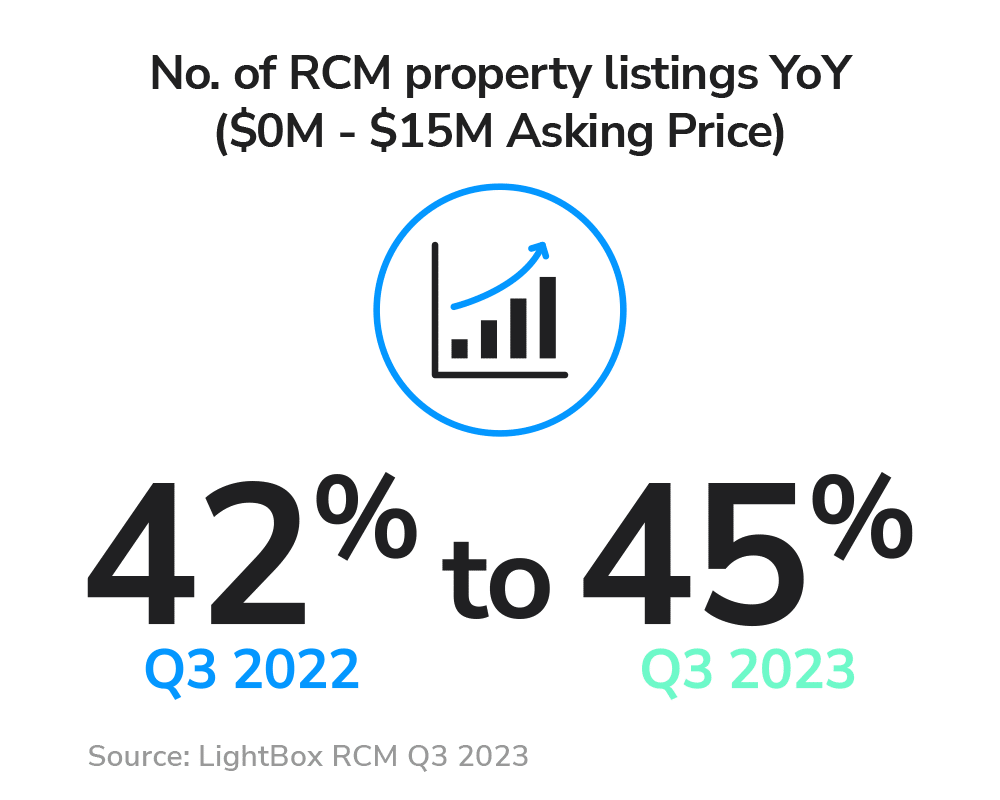
Many of these retail deals – 60% – primarily involved standalone properties. As interest cost rises and debt increases, investors may be looking to realize their returns after a meaningful hold period. At an enticing price point, there are simply more buyers able to close deals with little or no institutional help
Assets Listed above $50 million Remained Stable
Assets priced between $50 million and $250 million remained relatively stable year over year, primarily due to multifamily making up 60% of listings. As we mentioned previously, multifamily is still attracting a lot of interest from investors.
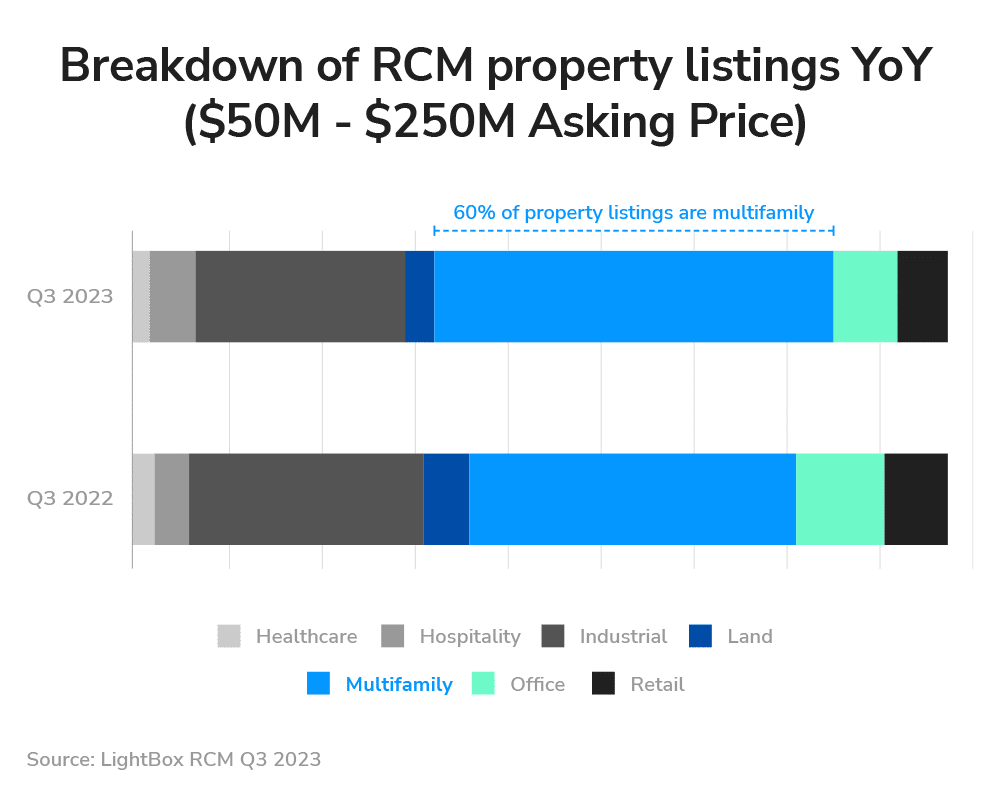
The supply-constrained housing market in the U.S. continues to drive demand for multifamily properties. To add a bit more context, with debt capital harder to find for most commercial acquisitions, lending for multifamily investments remains available with Freddie Mac and Fannie Mae very much open for business. This availability of debt capital is compelling for investors, as it translates into less uncertainty about property values and the potential for steady returns on investment. Additionally, the larger institutional assets tend to enjoy high occupancy, top-level amenities and better investment stability.
RCM Transaction Volume Declined
It’s widely known that transaction volume has decreased – the overall market is down around 50%. Despite this downturn, there’s a positive aspect to highlight. When comparing year-over-year activity (Q3 2023 versus Q3 2022), RCM Transaction Volume has managed to maintain a degree of stability, showing a moderate decline of 17%.
To provide context for this decrease, at the beginning of this post, we noted the macro forces that are driving a “wait and see” approach of many market participants. The bid-ask spread is still very wide, which suggests there is still a lot of uncertainty on both sides of a trade.
A key contributor to the decline continues to be office properties. Obviously, this segment took a huge hit at the onset of the COVID-19 pandemic, and it has yet to recover with many workforces remaining remote. Vacancy rates have skyrocketed as high as 24% (with the historically typical range between 3% and 7%) – meaning owners are struggling to meet debt payments and banks will probably have to take over assets and determine the best strategy to minimize losses.
Identifying Potential Market Opportunities
For the foreseeable future, we’re going to continue to see the “wait and see” attitude; this is most likely the new post-pandemic status quo. We probably won’t see this mindset change until many of the fundamentals – like the economy, interest rates and office occupancy – are more stable and remain flat for some time. For investors, brokers and industry professionals, adapting to these market changes effectively comes down to staying open to emerging opportunities.
About LightBox RCM Transaction Activity
LightBox RCMTM (formerly Real Capital Markets) is the industry’s leading go-to-market listing platform, a global marketplace for commercial real estate investment sales, as well as debt and equity deals. With a proprietary database of more than 84,000 qualified investors and principals, the RCM platform provides a trusted gauge for CRE deal velocity and engagement. LightBox releases quarterly snapshots that report on aggregate volume of listings, deals or properties brought to market.
1NOTE: Details on the new LightBox CRE Activity index can be found in the CRE Market Snapshot series. Part 1 covers lender-driven appraisal trends and Part 2 analyzes trends in the Phase I ESA sector. In Q4, LightBox will launch Part 3, focused on quarterly trends in the broker/investment sector.
In this dynamic and uncertain environment, brokers, buyers, sellers and lending professionals must remain agile and well-informed. To gain market-moving insights from industry experts, sign up and subscribe now to LightBox Insights.