

Top Macro Market Developments
- Financial Markets – Fed scales back size of rate hikes; uncertainty slows deal flow
- Lending – 1st bank failures since GFC tighten underwriting standards further, and shed light on lending sector’s CRE risk exposure.
- Asset Class — Growing concerns about office loan defaults, rising distress
- LightBox Market Metrics – Across-the-board declines in YonY volumes in property listings (37%), environmental due diligence (28%), and lender-driven appraisals (43%).
MACRO COMMENTARY
Q1 2023: Pervasive uncertainty amid deal flow decline, bank solvency issues, interest rate hikes
Three years have passed since the onset of the pandemic and the commercial real estate market has clearly not settled into a “new normal.” With commercial property lending restrained, continued pricing uncertainty and growing recession fears, the market is navigating through unchartered waters post-COVID.
LightBox’s market metrics provide an early indicator of trends in the investment, broker, valuation, lending, and environmental due diligence segments. Here’s how the first quarter played out, with a look to how the market looks as mid-year approaches.
Looking at Commercial Real Estate market trends in Q1 2023
At the start of 2023, a cloud of uncertainty hung over commercial real estate as the market continued to adjust to dramatic shifts in market dynamics in the second half of 2022. Q123 brought a more pronounced slowdown in investment and lending activity than expected and ended with a gut punch from the first bank failures since the Great Financial Crisis.
Like this year’s Oscars’ Best Picture “Everything Everywhere All At Once,” the market had to digest a rapid mix of developments, including the higher cost of capital in the wake of 2022’s record interest rate hikes. Amid the most aggressive tightening of financial conditions by the Fed since the 1980s, investors and lenders are now being challenged to pencil deals under a cloud of uncertainty that makes forecasting future rent rolls, operating costs and valuations difficult. While the near-term forecast is less sanguine in many ways than it was at New Year’s, there is still an even mix of headwinds and tailwinds shaping the near-term forecast.
In early February, the Fed signaled that slowing inflation, along with other indicators, warranted a tempering of the size of rate hikes. An expected 50 bps increase became a 25 bps increase in February, followed by the same in March (and a third in early May). This was a welcome sign to the market that the record-high hikes of late 2022 could be in the rear-view mirror. Shortly after, the failures of Silicon Valley Bank and Signature Bank sparked concerns that a systemic bank crisis could be ahead.
What a difference a year makes. At the start of 2022, forecasters were bullishly calling for commercial real estate investment and lending levels to be nearly as good as 2021, which set new records for deal-making and lending volumes. Early 2023 forecasts that called for a second half to be busier than the first half no longer seem as definite. Some institutional buyers are “pencils down” until more clarity emerges, although there are early signs that money is moving back into play for the right opportunities.
2023 Commercial Real Estate market predictions
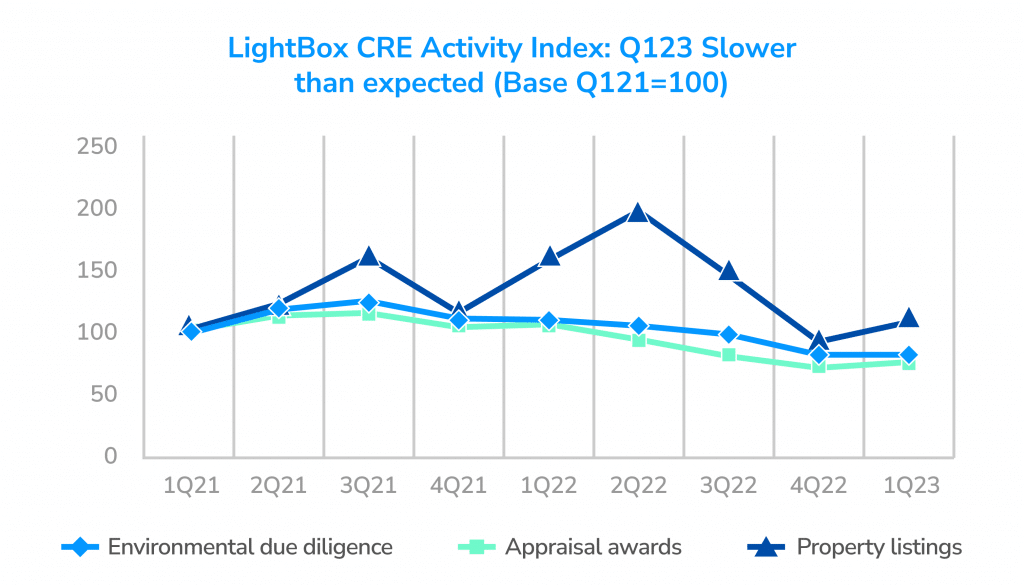
As the result of changing market dynamics last year, the LightBox Commercial Real Estate Activity Index reflects an atypically slow 4th quarter for commercial real estate property listings, and appraisal and environmental due diligence activity followed by a minor uptick in commercial properties listed for sale (blue line) in Q123. As lenders pulled back from originations and risk tolerance fell, activity in 2H22 declined noticeably across the board, resulting in the fourth quarter being the slowest. The property listings in LightBox’s RCM platform increased 26% above activity in the abnormally-slow 4Q22 but 37% below listing activity from one year ago. All eyes are on how listing activity responds to the unrest of Q1’23 as the market adjusts to more moderate interest rate hikes and the impact of higher capital costs on property pricing.
MSCI’s latest data reports that Q1 CRE investment volume was down 24% YonY (based on number of properties). It is encouraging, however, to see that investment levels of $85B in Q1’23 are in sync with the historical pre-COVID Q1 average of $88B for the period spanning 2005-2019.
Other noteworthy market developments in Q123 include:
- Buyer profile shifts — While CRE owners are listing properties for sale, the size of the buyer universe is still somewhat constrained, leaning toward cash-only buyers, private capital or family funds rather than traditional investors. Higher costs of capital are shutting some buyers out of financing and with transactions down, price resets are still to be determined. Based on recent developments, there are fewer buyers at the table.
- Contracting buyer pool — Confidentiality agreements in the LightBox RCM platform, an indicator of how the size of the buyer pool is changing over time, fell from a high of 131 per deal last January to only 65 by year-end 2022 as buyers were shut out of the market by higher capital costs or opted to retreat to the sidelines to wait out the growing uncertainty. In Q123, the average number of CAs per deal increased slightly to 72, but still well below the high-water mark of a year ago. (Note that CAs can vary significantly by asset class.] CAs per deal will be an important metric to watch as the year progresses. If market uncertainty dissipates, the number of CAs could begin climbing again, a sign that buyers are moving capital back into play.
- Environmental due diligence and appraisal volumes decline – In response to a slower transactions market, it is not surprising that demand for environmental due diligence and appraisals are at historically low levels. LightBox’s ScoreKeeper model estimates that Phase I environmental site assessment volume was down 28% YOY, and lender-driven appraisal volume, measured by activity in Lightbox’s C360/RIMS platforms showed a similar 43% decline YOY. Near-term appraisal demand is likely to remain muted as lenders adjust to three more interest rate hikes this year, the wave of expected loan maturities, and the fallout from recent bank failures.
[More detail on the LightBox CRE Activity Index can be found at the end of the report.]
FORECAST: Bracing, Waiting and Watching
Risk factors CRE Investors should look out for in 2023
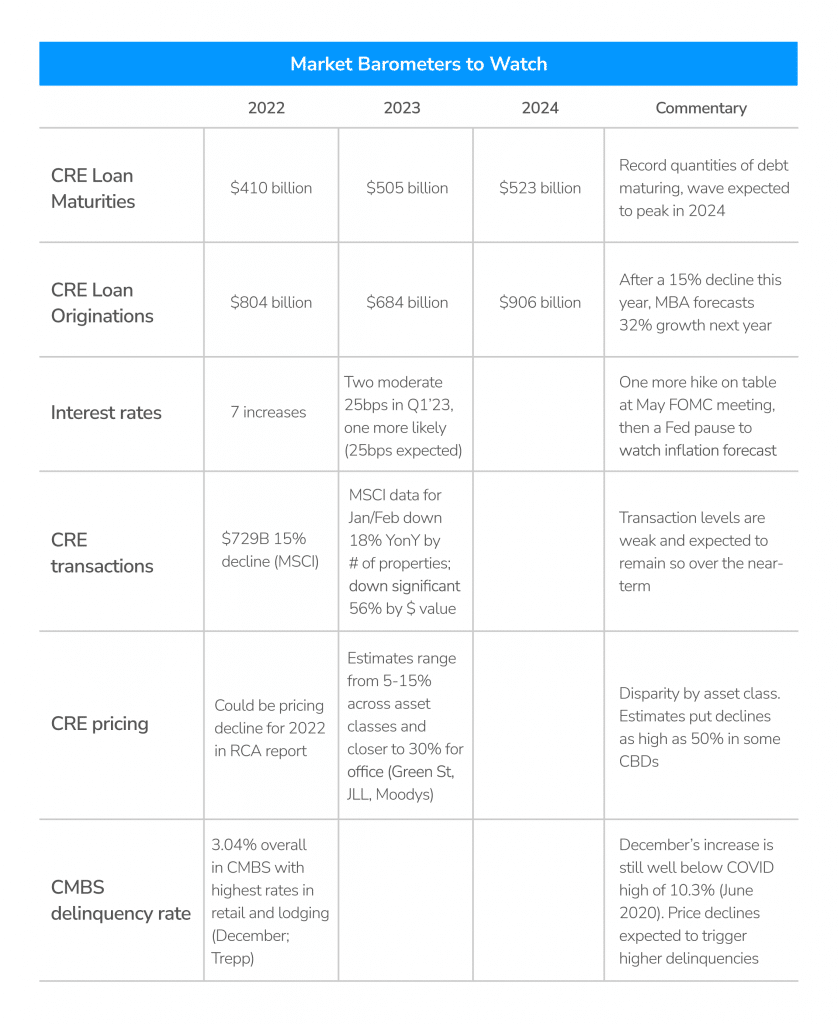
The commercial real estate market is entering a critical phase and growing uncertainty as mid-year approaches. There is no shortage of developments to watch, including:
- Market Sentiment – Commercial real estate investment correlates closely to market sentiment so it will be important to track how attitudes are changing in response to shifts in barometers. LightBox’s Investor Sentiment report, based on a broad-based 2Q23 survey of CRE professionals, is set for release in June and will provide valuable insights into how perceptions of the market are changing and how expectations for 2H23 are taking shape.
- CRE Lending Forecast – In 2022, lenders pulled back the reins on loan originations and adopted a more risk averse stance in their underwriting. March’s bank failures sent shockwaves through the financial sector, causing many banks to tighten their lending practices even further. In response, the Mortgage Bankers Association dialed back its 2023 forecast for CRE lending to a 15% decline YOY, followed by a 32% bounce-back next year. It will be important to watch how this forecast plays out and if the MBA reforecasts its near-term estimate.
- Shifting Deal Flow Parameters – In a declining price environment, it’s all about value. The numbers and assumptions need to make sense. Will that retail center be worth more in a few years? Will NOI/vacancy rates/rent growth assumptions support the asking price? As the buyer pool thins amid rising rates, have far will sellers need to go to make concessions? It is critical in uncertain environments that investors conduct thorough due diligence and ground-truth assumptions about future rent rolls, operating costs and occupancy.
- Trajectory of Transaction Volumes — Expect the slowdown in transaction volume to continue as rates and valuations establish a new equilibrium. The shortage of sales comps over the past year is causing some valuations to be “imagineered.” As actual sale comps replace educated estimates, valuations across the board could drop significantly in some areas and asset classes.
- Shifting Property Valuations — Appraisers will play an important role in the property valuation reset that is coming to close the gap on the bid-ask spread that’s stalling deals. The market is struggling to digest that rapid rate of change in interest rates, which is moving pricing down by 5% to 15% on most asset classes and potentially 30% for office. The next three quarters will be challenging as sellers come to terms with new rates. It could get more challenging before conditions improve.
Despite the doomsday headlines, it’s important to remember that the CRE industry is an extremely diverse one. There will be pain – and there will also be opportunities in this time of transition.
The commercial real estate lending sector is much stronger today than it was pre-Great Financial Crisis and while we may see more bank failures, it won’t come close to the magnitude we saw then. Generalizations in the headlines warrant a bit of caution. Commercial real estate is resilient, there is a lot of capital looking for new opportunities as we get more clarity on interest rates, prices, and the timing/duration of a recession.
Until then, prudent risk management is in the front seat. The Wall Street Journal recently wrote that a “chief risk officer plays one of the most important and least appreciated roles in American business. The people in these positions succeed if their companies avert failure.” The most important thing is to watch, wait and exercise caution rather than overreacting to broad-based, alarmist predictions.
CRE Market Metrics to watch in 2023
What forces will shape CRE lending/investment in the second half?
| Pros | Cons |
| Record amount of equity targeting US CRE | CRE bank lending is more constrained and cautious in the wake of bank failures |
| Nearing the likely end of the rising interest rates cycle | Loan defaults will hurt banks with high concentrations of CRE exposure, especially regionals |
| Supply chain issues improved | Less bank CRE lending will limit transaction activity beyond early-year expectations |
| Demand for CRE is still robust | Inflation is still well above target levels |
| Role of risk managers is front and center | CRE property price resets could be as high as 20% across asset classes, even high in office |
| LTVs (loan to value ratio) in the healthy 55-60% range vs. 70-80% during the GCF | $900B in CRE loans maturing in 2023 and 2024 under much tighter financial and market conditions |
| Inflation rose at the slowest pace in almost two years | Hybrid/remote work policies and shift to smaller office footprints reducing office space demand |
| Pricing resets trigger buying opportunities | Loans and properties experiencing loss in value could drive higher delinquencies |
ABOUT THE LIGHTBOX CRE ACTIVITY INDEX
LightBox data and platforms support a range of due diligence functions, including appraisals, evaluations, property condition assessments, Phase I environmental site assessments, inspections, and climate risk assessments. The LightBox CRE Activity Index is derived from the following three inputs:
- LightBox’s ScoreKeeper model is the market monitor for the environmental due diligence industry, and the source of time-series data on Phase I environmental site assessment activity by region, state, metropolitan area, and county. ScoreKeeper™ data output is generated via a model using as its key input orders placed by environmental consultants for LightBox’s government records check reports which are required components of Phase I environmental site assessments, extrapolated up to market level activity estimates. The environmental due diligence activity index is based on ScoreKeeper’s estimates of quarterly U.S. Phase I ESA activity.
- LightBox’s Collateral360 and RIMS platforms support are used by financial institutions to manage and procure appraisal projects in support of commercial real estate property lending activity. Each year, these platforms are used to manage more than 250,000 loans for assignments totaling over $500B in annual fees. The appraisal activity index is based on appraisal awards from more than 1,200 banks and credit unions across the United States and reflects industry benchmarks specific to lender-driven commercial property appraisal activity.
- LightBox’s RCM platform is used to support more than 50% of all US commercial property transactions each year. The property listings activity index is based on the number of property listings in the RCM platform by quarter as an early indicator of changes in broker/investor behavior in response to changing market conditions.
Activity by quarter for property listings, environmental due diligence and appraisal volume is normalized to a Q121 baseline to enable analysis of the relative changes in quarterly activity in each sector over time one a consistent basis.