
LightBox CRE Activity Index Holds Steady in March as Market Enters Test Phase
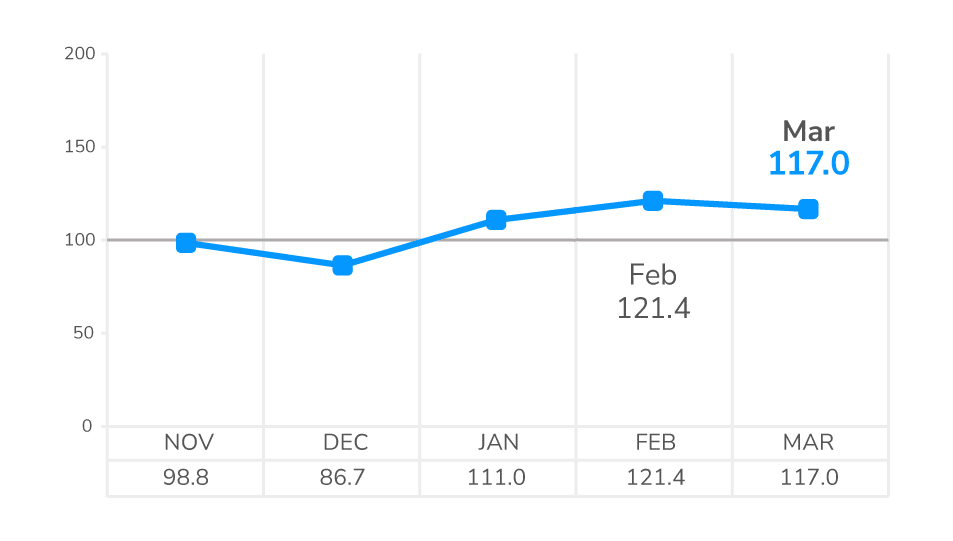
Commercial real estate activity remained resilient in March, with the LightBox CRE Activity Index holding firmly in triple-digit territory for the third consecutive month. The Index registered 117.0, down slightly from February’s recent high of 121.4 but still above January’s strong start to the year.
The reading reinforces a consistent theme for Q1: CRE activity has held steady, even as external conditions have grown more volatile. At 7% above year-ago levels, March ranks among the stronger readings since mid-2022, supported by active transaction pipelines and continued capital deployment across core CRE functions.
The progression from 86.7 in December to 117.0 in March marks a notable recovery, though the market is now entering a period where that momentum may be tested. Recent geopolitical developments, rising oil prices, and higher borrowing costs have introduced new uncertainty heading into Q2.
The LightBox CRE Activity Index aggregates daily activity across commercial property listings, environmental due diligence, and lender-driven appraisals. Drawing on more than 30,000 monthly data points, it serves as an early indicator of CRE lending and investment momentum.
Signals Behind the March Index:
- Listings Activity: Average daily listings declined 4% from February’s surge but remain 19% higher year over year, reflecting continued seller activity and asset repositioning.
- Environmental Due Diligence: Phase I ESA activity rose 3% month over month, marking the third consecutive increase and signaling continued expansion of transaction pipelines.
- Appraisal Activity: Total appraisal volume increased 4%, driven by refinancing and maturity-related demand, while daily average volume declined 10% following February’s elevated pace.
LightBox CRE Activity Index at a Glance
NOTE: The LightBox CRE Activity Index is based on changes in environmental due diligence (measured by Phase I ESA volume), commercial property listings, and valuation market activity indexed to a baseline (Q1 2021 monthly average =100). The index is normalized to account for variations in the number of business days per month. The historical CRE Activity Index has been normalized to consistently include historical and current listings across LightBox platforms. The Index value reported for the most recent month may be revised in the subsequent publication as LightBox finalizes the input datasets.
Will CRE Activity Hold as the Market Moves into Q2?
The strong start to 2026 raises an important question: can CRE activity maintain its footing as macro pressures build?
For now, the data suggests that core market functions remain intact. Listings, environmental due diligence, and appraisal activity continue at healthy levels, and capital is still being deployed across asset classes.
However, much of this activity reflects deals initiated earlier in the quarter. As the market moves into Q2, April will serve as an important indicator of how activity responds to sustained volatility, higher borrowing costs, and ongoing geopolitical uncertainty.
Read the full March LightBox CRE Activity Index report for additional analysis and insights.
For more information about this report or the data, email insights@lightboxre.com