
This will allow you to make smarter decisions in less time.
LightBox and Oak Ridge National Laboratory have collaborated to build a 50-year predictive model for energy and consumption at a building level employing LightBox SmartFabric, the broadest and deepest property dataset. The project produced estimates for energy consumption for more than 150 million buildings, using four climate scenarios as defined by the Intergovernmental Panel on Climate Change (IPCC).
The goal of creating these estimates is to help anyone with a stake in or responsibility for larger property portfolios avoid blind risks and better understand future energy use and costs.
The first step in solving the looming climate crisis is to understand the scope of changes we can expect. Real estate contributes nearly 40% to global emissions, so it is a sector that has the potential to continually worsen emissions or one that we can all invest in mitigating and reducing its climate impact.
This dataset provides a building level view of how various levels of success reducing emissions will impact energy demand from buildings across the United States. It was designed to help direct investment and understanding of future risks.
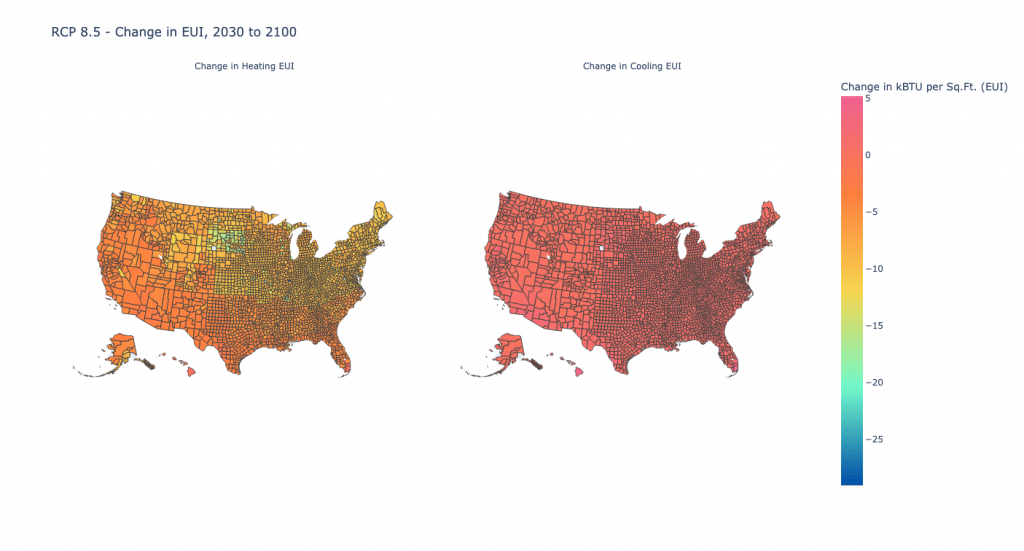
The heatmap shown below displays the total change in energy use intensity (EUI) from 2030 to 2100, aggregated by county. EUI is simply a measure of energy consumption per square foot, which we calculated by taking the entire energy consumption for every building within a county and scaling by aggregate county building square footage. The map displays this change for the representative concentration pathway 8.5, which is usually viewed as the “business as usual” scenario that will occur if we choose not to effectively curb emissions.
Aside from Hawaii and a few counties in Florida, the total energy demand from buildings is forecast to actually decrease as temperatures rise. This is driven by a balance between heating and cooling demands, whereby the warmer temperatures decrease the nation’s heating requirements in winter months more than the increase in cooling requirements in the summer months.
Despite this net anticipated decrease in energy demand, the peak energy demand for cooling is forecast to increase, indicating that there could be additional pressures on the energy infrastructure in its current state. The heatmap below demonstrates the change in anticipated energy consumption needed for cooling.
States such as Colorado, which currently doesn’t require nearly as much air conditioning as other states, will see a large increase in the need for additional or updated HVAC systems. The same goes for Mountain states like Montana, Wyoming, Utah, and Idaho as well as the Northwest. That shift means increased energy use for cooling for properties that may not have previously needed it.
What does this mean for you if you’re involved with a larger property portfolio?
If you can better understand future energy costs of properties within and out of your portfolio, you can make more informed decisions to anticipate and ameliorate those increases. It can also help you to plan in advance to keep your ESG ratings out of the “risk” area. It will help appraisers better estimate the overall value of a property. And the LightBox/Oak Ridge predictive modeling can help you better analyze properties at scale so you can do the most complete due diligence on property footprints, staying compliant with regional regulations such as New York Local Law 97.
In other words, you can use our predictive model to help you strengthen and future-proof your portfolio.
What are the data points LightBox enables?
- Building energy consumption in kBTUs
- Estimated emissions (CO2) given the estimated consumption and energy grid mix assumptions
- Estimated energy cost, given energy grid mix and energy price assumptions
- Climate models: RCP 2.6, RCP 4.5, RCP 6, and RCP 8.5, for forecast years 2030, 2045 and 2100
That kind of specific information can be essential to managing policy and decision making; projecting future property expenses; estimating future energy grid constraints; and more.
If you’re interested in understanding what future energy use means to your portfolio, talk with us. Our predictive model is the first comprehensive, climate-adjusted model for every structure in the United States.
LightBox Labs focuses on identifying data, technology and trends that will impact the commercial real estate and geospatial intelligence industries in the near future and building rapid prototypes to test in the market. Current areas of focus include building an ecosystem of climate change information as it relates to properties, information extraction from unstructured data, and machine learning model development to improve data richness across our assets.